New Trade Idea for Small-Cap Medical Name Seeing Odd Pre-Earnings Surge
The Owens & Minor stock charts compels a deeper dive.
You've reached your free article limit
You've read 0 of 1 free Pro articles.
Medical and surgical supplies distributor Owens & Minor OMI is set to release the firm's first quarter financial results ahead of the opening bell this Thursday, May 8. Wall Street is looking for an adjusted EPS of $0.20 (or a GAAP EPS of -$0.15) on revenue of $2.66 billion. This would compare to the year-ago adjusted result of $0.19 on revenue growth of roughly 2%. Of the seven sell-side analysts I have found that track the stock, four have revised their earnings estimates lower since the start of the quarter. None have revised their estimates higher.
Of these analysts, since mid-March, three highlight rated analysts have taken their target prices for the stock lower:
- Lisa Gill (five stars at TipRanks) of JP Morgan, who rates OMI as a "sell," took her target down to $10 from $14
- Daniel Grosslight (4 stars at TipRanks) of Citigroup, who rates OMI as a "buy," took his target price down to $11 from $13
- Eric Coldwell (4.5 stars at TipRanks) of Robert W. Baird, who rates OMI as a "hold," took his target price down to $9 from $11
All that said, the stock is up close to 6.8% on Monday morning ahead of those earnings. One has to ask oneself: "Self, is something going on at Owens & Minor?"
Past Earnings Have Been Mixed
Three months ago, the firm posted an adjusted EPS of $0.55, beating Wall Street, but a GAAP EPS of -$3.84 on revenue that also beat expectations.
So, huge adjustments have been commonplace in order for the firm to show non-GAAP profitability. The adjustments came from goodwill impairment charges amounting to $3.95 per share plus $0.45 worth of acquisition and realignment charges. In short, the firm really wasn't that close to being profitable.
Fundamentals
For the trailing 12 months as of December, Owens & Minor generated operating cash flow of $161.5 million. Out of that number came capex spending of $210.9 million. leaving free cash flow of -$49.4 million. This was paved over with sales of property and equipment worth $103.4 million offset slightly by $17.3 million worth of purchased intangible assets. The firm is obviously in no position to return capital to shareholders.
Turning to the balance sheet, as of the December quarter, the firm had a cash position of $49.4 million, inventories of $1.132 billion and current assets of $2.021 billion. Current liabilities added up to $1.874 billion, which included shorter-term debt of $42.9 million. All of that put the firm's current ratio at an acceptable 1.08, but with a quick ratio of 0.47, which is pretty darned awful and implies that the firm could have issues meeting short to medium term obligations during a crisis if inventories do not end up being worth the value that they have been recorded at.
Total assets amount to $4.656 billion, including goodwill and other intangibles of $1.671 billion. At 36% of total assets, that's not wonderful, but also not unheard of. Total liabilities less equity came to $4.091 billion including a staggering long-term debt-load of $1.801 billion. No, this is not one of the healthier balance sheets we have taken a look at in this column. In fact it's well below average. Well, well below average.
The Charts
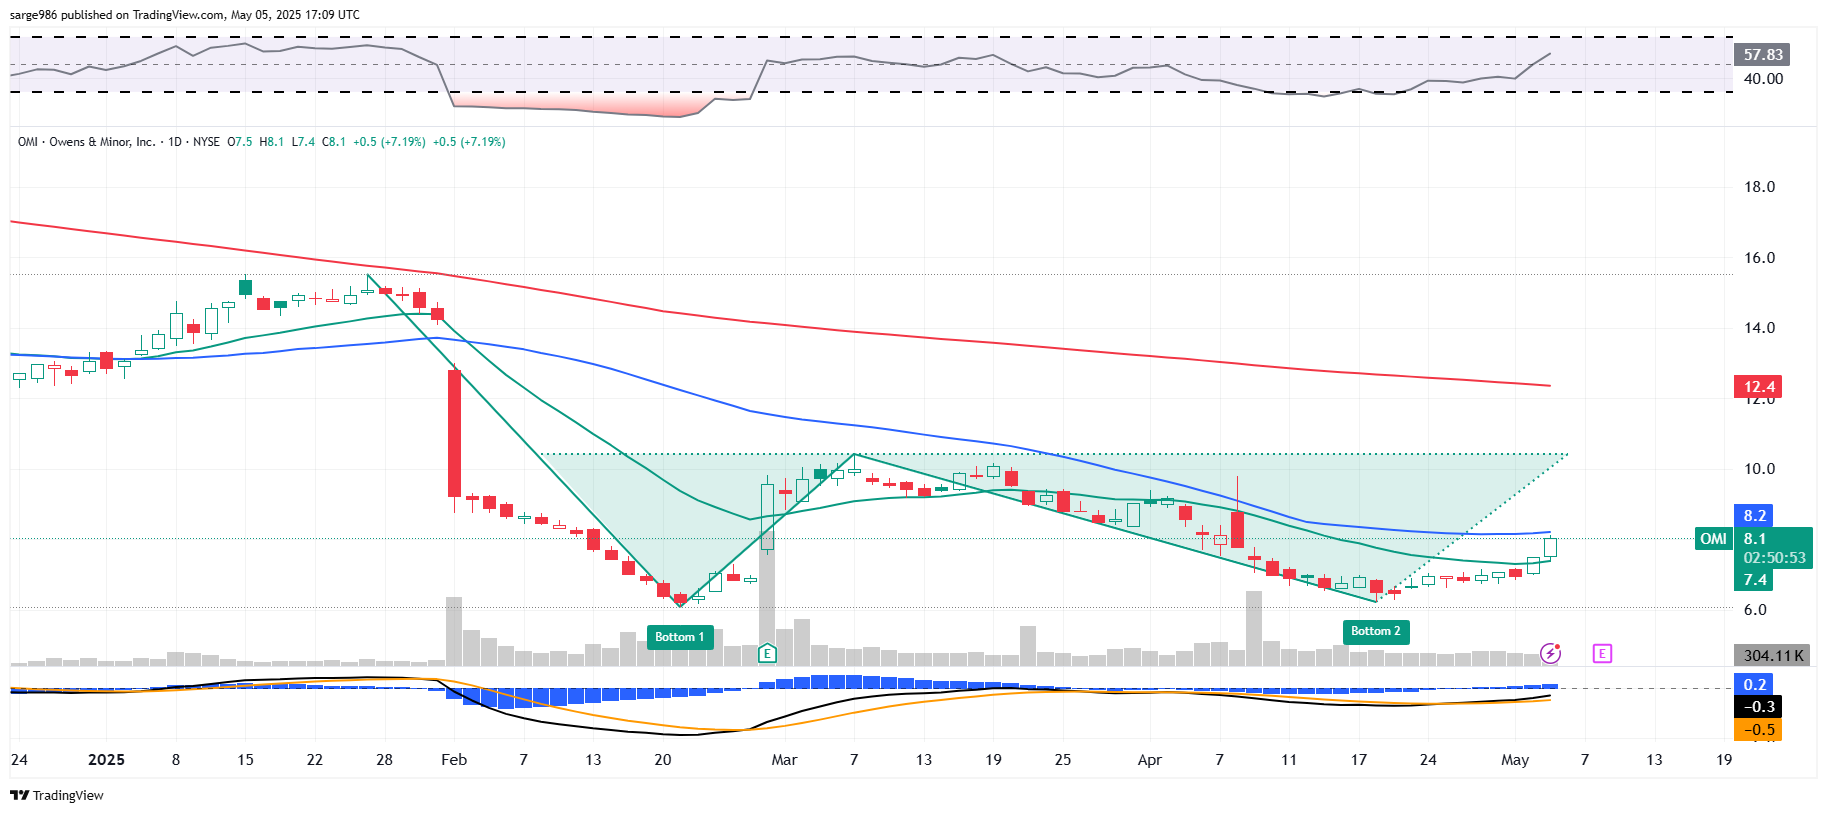
Readers will see that with the stock trading higher ahead of the numbers that a double-bottom pattern of bullish reversal has developed as relative strength has improved and the still not a bullish daily MACD has started to look better. Then, I kept looking at the chart and I saw something else.
See those black lines that I drew on top of the original chart? That's a descending triangle, which is a bearish pattern. We have conflicting signals all while the markets appear to be trying to tell us that something is going on. I have noticed that May 16 $8 calls have been way more active than anything else expiring that day and that $10 May 16 calls have been active as well. The May 16 expiration put side of the OMI options market is as dead as a doornail.
Trade Idea
I don't want to invest in this name. The fundamentals are not up to my standards. However, I am not opposed to taking on a lower risk options trade going into earnings with a short-term upside bias.
- Purchase one May 16 $8 call for about $0.70
- Sell one May 16 $8 put for roughly $0.65
- Purchase one May 16 $7 put for about $0.30
- Net Debit: $0.35
Notes: The Idea is to get long the $8 May 16 calls, while partially offsetting the net debit with the sale of a like number of same date expiration $8 puts. The reason for the acquisition of a like number of $7 puts is simply for downside protection should the trade end up forced to eat the shares at $8. The trader would need the equity to trade above $8.35 at expiration in order for the trade to be profitable.
At the time of publication, Guilfoyle had no positions in any securities mentioned.
