New Trade Idea for DraftKings After Ugly Earnings Report
Here's what I'm thinking after the gambling leader posted its financial results.
You've reached your free article limit
You've read 0 of 1 free Pro articles.
On Thursday evening, DraftKings (DKNG) released the firm's fourth quarter financial results. For the period ended December 31, 2025, DraftKings posted an adjusted EPS of $0.36 (GAAP EPS: $0.25) on revenue of $1.989 billion. That top-line print was good for year-over-year growth of 43.2% and did beat expectations. However, the adjusted bottom-line number fell 5 cents a share short of what Wall Street was looking for.
Though the increase in revenue was driven by "healthy" customer engagement, monthly average users remained unchanged from the year-ago period at 4.8 million unique paying (MUP) customers. Excluding "Jackpot," these MUPs would have shown a 5% gain. Average revenue per MUP printed at $139, and that was up 43% from the year-ago comp. Sportsbook and iGaming were largely responsible for that gain.
Operations
As mentioned above, revenue popped for that 43.2% annual gain.
After all costs and operating expenses, GAAP operating income improved from -$139.179 million a year ago to $151.76 million. Once interest, other income and expenses and taxes are accounted for, GAAP net income attributable to shareholders printed at $136.426 million, up from -$134.851 million. That works out to a GAAP EPS of $0.25, up sharply from the year-ago comparison of -$0.28. After adjustments made for the amortization of acquired assets, stock-based compensation and the tax impacts of adjusting these items and a few others to lesser degrees, the adjusted EPS print hit the tape at $0.36, up from $0.14.
Guidance
For the full fiscal year just started, DraftKings is projecting revenue of $6.5 billion to $6.9 billion and adjusted EBITDA of $700 million and $900 million. This is primarily why the shares are trading lower. While the adjusted EPS miss was alarming in its own right, the revenue guidance, here, at the midpoint is a country mile below the $7.3 billion or so that Wall Street had priced into the stock. That's a more-than-significant miss.
Fundamentals
For the year completed, DraftKings generated operating cash flow of $662.855 million. Out of that came just $15.352 million in traditional capex spending, but also $131.154 million spent on internally developed software. That left free cash flow of $516.349 million. The firm does not pay shareholders a cash dividend but did repurchase $571.528 million in common stock for the corporate treasury. That's a little on the sloppy side if you ask me.
Turning to the balance sheet, DraftKings ended the period with a cash position of $1.135 billion and current assets of $1.815 billion. Current liabilities add up to $1.755 billion, leaving the firm with a passable, but certainly not sterling, current ratio of 1.03.
Total assets amount to $4.531 billion. This includes $2.487 billion in goodwill and other intangibles. At almost 55% of total assets, I find that mildly alarming. Total liabilities less equity comes to $3.899 billion, including $1.836 billion in total debt. That's a lot, but with the decent sized cash balance, certainly serviceable. The firm might want to better manage its cash flows going forward. Just an idea for the CFO.
Something else for shareholders to be cognizant of is this: Of that $1.836 billion debt load, $1.259 billion is in the form of convertible notes that could ultimately dilute the firm's equity value on a per share basis.
My Thoughts
I don't love the stock. I don't love the mismanagement of cash flows. I don't love the balance sheet. I don't love the size of the debt load, nor do I love the way it is structured. The shares came in expensive for the current environment at 41 times forward-looking earnings. Regardless of all of that, is this a dip providing opportunity, at least to traders? Let's go to the chart:
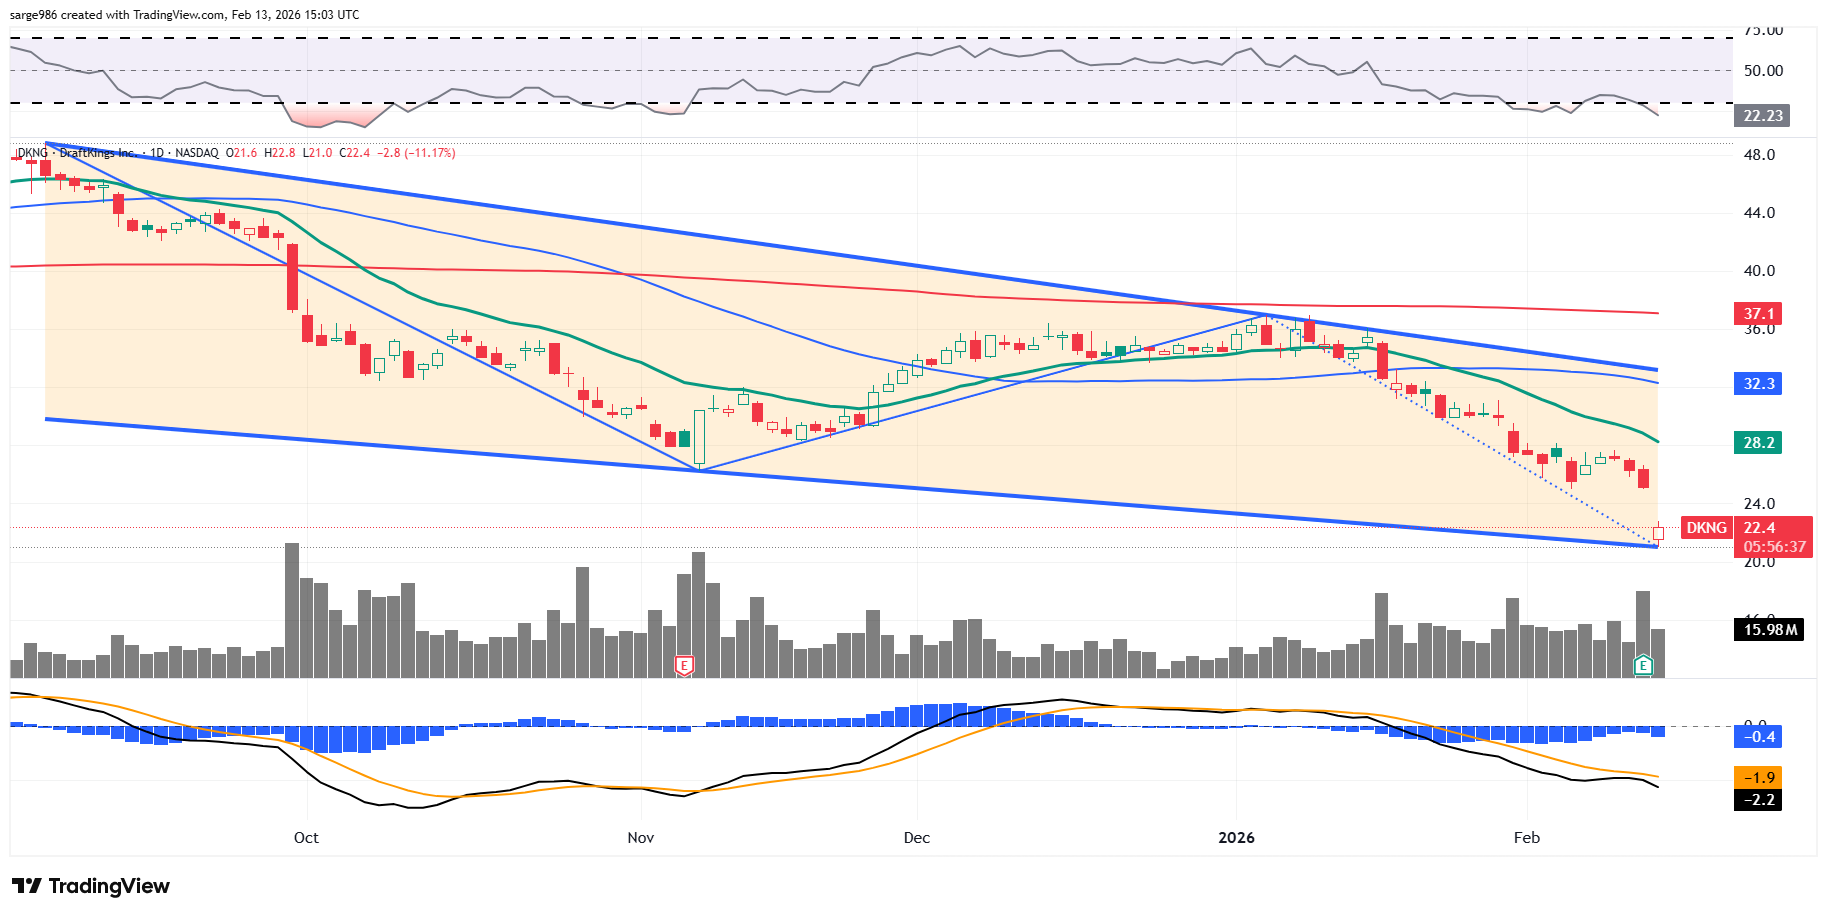
We do have a falling-wedge pattern of bullish reversal quite visible on this chart. Though the shares are trading below their 21-day EMA, 50-day SMA and 200-day SMA, meaning they have lost both the swing crowd and the pros, the indicators are severely oversold from a technical perspective.
Relative strength is more than relatively weak. The daily MACD looks like something out of a monster movie with all three components showing nothing but bearish signals, which to me, means that on a limited scale, a bullish bet could be made (get the pun on gambling?).
Instead of going out and laying down some capital for a chunk of equity. I'm more thinking of writing March 20 $22.50 puts for about $1.80. Even if I do get tagged, the shares would bear a net basis of $20.70. With an unfilled gap created on Friday morning, that might not be a bad play.
At the time of publication, Guilfoyle had no positions in any securities mentioned.
