New SoFi Price Target as Technical Picture Changes Dramatically
Let's catch up on this longtime Sarge-folio stock, check the chart patterns and devise a plan.
You've reached your free article limit
You've read 0 of 1 free Pro articles.
SoFi Technologies (SOFI) has long been a mainstay of both the "Stocks Under $10" portfolio, which used to run of TheStreet Pro, and the Sarge-folio itself. November was a wild month both for the stock market and for this stock. I tried to stay on top of it for our readers, but I had to attend my son's wedding rehearsal dinner, which angered some of our readers, and then I had to take off the last week and change of November.
There is no need to rehash the terrific quarter that CEO Anthony Noto reported in late October. I know that I have already gone into significant depth on the company's performance.
SoFi will report next in late January. Wall Street is looking for unadjusted earnings per share of $0.12, which would compare quite well to $0.05 for the year-ago period. Wall Street also expects to see revenue growth of roughly 34% year over year. A dozen sell-side analysts cover SOFI and all have revised their estimates for the quarter to the upside.
Looking Back
I wrote to you three times on SOFI during November, as this is a focus stock both for my own book and for those who are in it with us since the "Stocks Under $10" days. Early in the month, I read a cup-with-handle pattern, which would be bullish and increased my price target from $37 to $40, as the pattern took my pivot from $30 to $32. The stock was trading with a $29 handle at the time.
Less than a week later, the stock was under pressure as the depth of that cup's handle grew. I stuck with my target at the time, and informed readers that I was adding to my long position on the dip. The shares were trading down to the low $27 area on that particular dip.
A week after that, with the shares back in the $27 area, I admitted that there could be some technical damage occurring. I informed readers that should the stock lose contact with its 50-day simple moving average, that I might be forced to adjust my target.
Here & Now...
SOFI did in fact lose contact with its 50-day SMA, bottoming at $23.52. I did add, but not close to the bottom. I was not in front of a computer and my execution was sloppy.
The stock has now completely recovered, but the technical picture has changed dramatically, which does force me to adjust my plan.
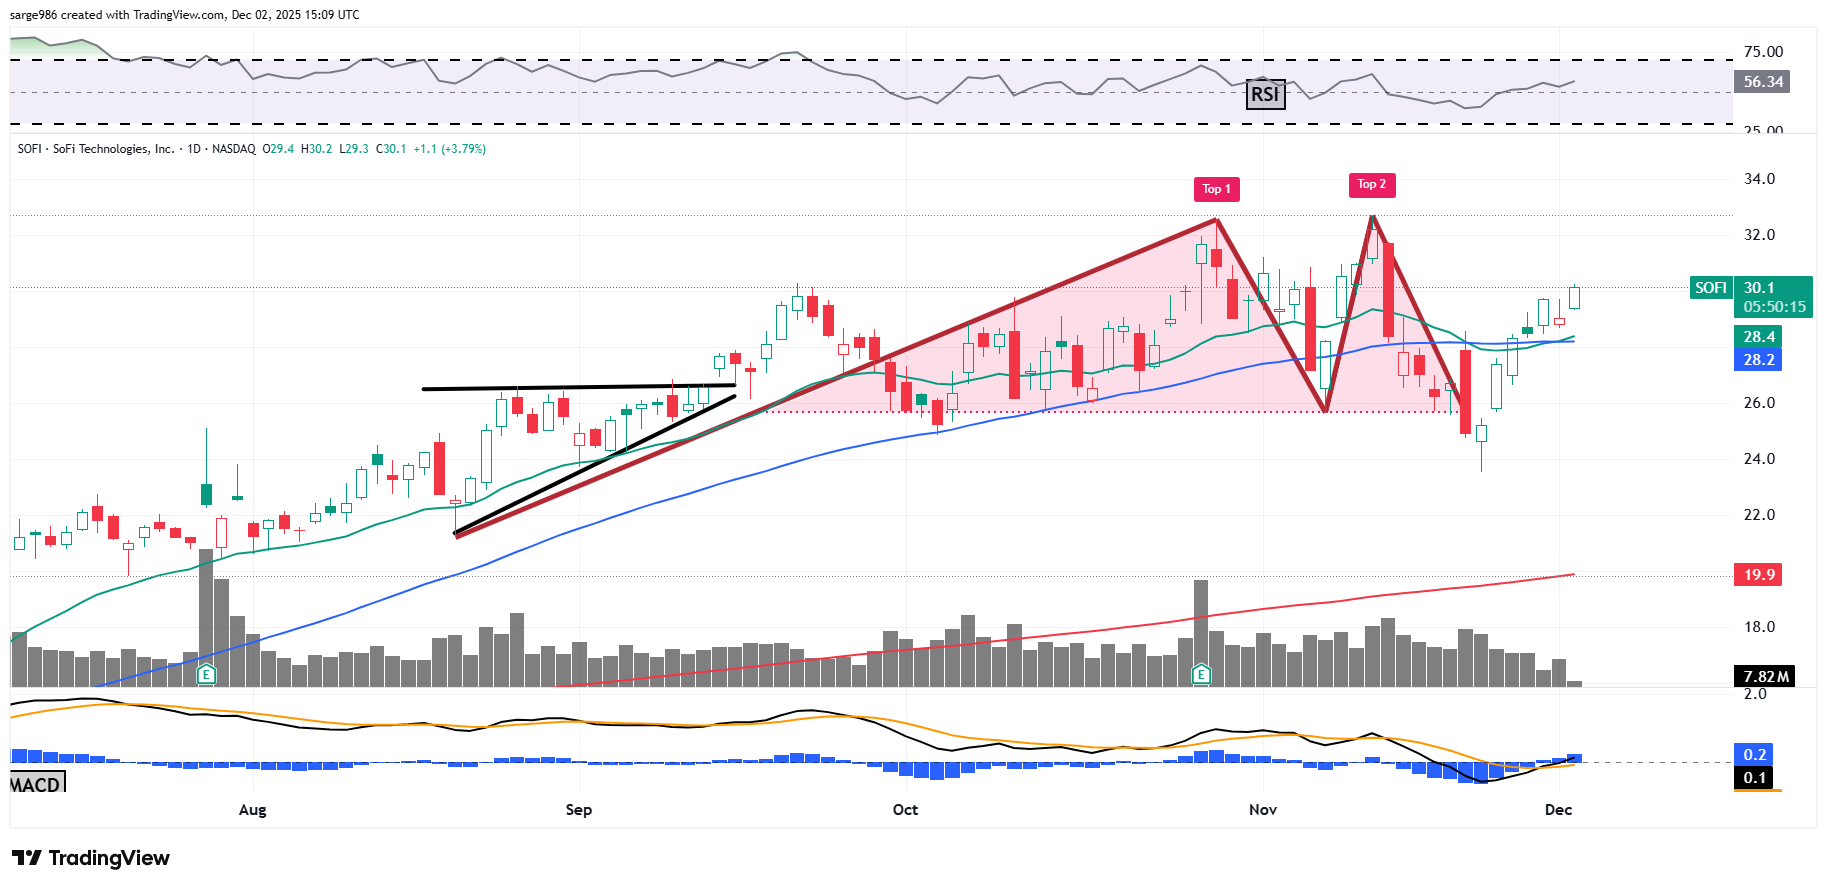
Notice that my cup-with-handle became a double-top pattern of bearish reversal with a $26 downside pivot. From there to the bottom was a drop of 8.3%.
As I have mentioned in the past, I shoot for drops of 8% to 10% on breakdowns from downside pivots. So, this may have been all that setup was willing to give.
This also made the stock's 50-day SMA, which has been retaken, our new upside pivot. That forces me to reduce my target, even though the stock is hot at the moment. Of course, this does not mean that we won't re-adjust later. It just means that we maintain our discipline at all times even when we don't love it.
My Plan
Price Target: $36 (down from $40)
Pivot: $28 (down from $32)
Add: At the 50-day SMA (currently $27.50)
Panic: Loss of the 200-day SMA (currently $20)
Note: A take and hold of a new all-time high (currently $32.73) would likely re-establish a target price of $40 or slightly higher.
At the time of publication, Guilfoyle was long SOFI equity.
