New SoFi Price Target as Key 'Handle' Develops on the Chart
A positive technical development forces our second target increase in a week.
You've reached your free article limit
You've read 0 of 1 free Pro articles.
Just a week ago, I provided a deep dive into SoFi Technologies (SOFI) . On that date, I explained how strong the company's third-quarter earnings had been.
For the quarter, SoFi had posted GAAP EPS of $0.11 on adjusted net revenue of $949.6 million (GAAP revenue of $961.6 million). As we explained, the company had adjusted the revenue number in order to annual growth of 36.3%. The bottom-line number beat expectations by three cents per share.
SoFi set a slew of quarterly records for the period. The guidance was strong as well. However, it is the chart that I am writing to you about today.
Developing a Handle
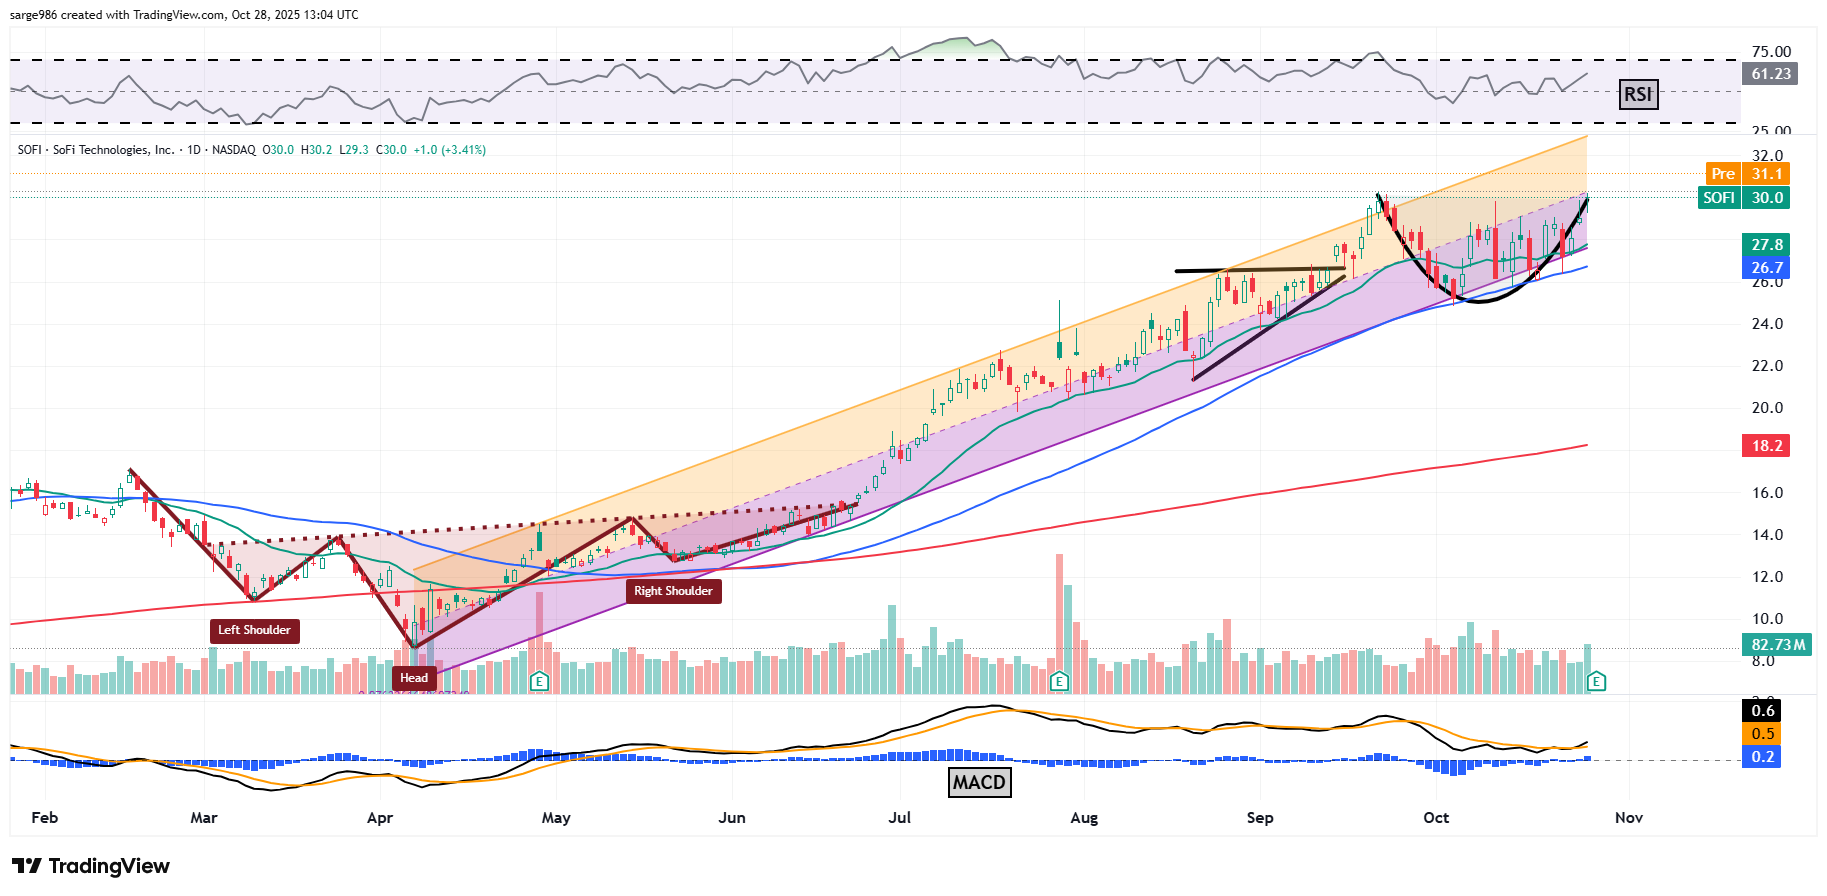
This is a copy of the chart that I showed readers on October 28. I explained that SOFI had exploded out of an inverted head-and-shoulders pattern this past summer into an ascending triangle of bullish continuance in August/September that propelled the stock higher still. Then we got to the cup pattern and I warned readers that a handle might develop.
Why is that important? Simple. The pivot provided by a cup pattern is the left side apex of said cup. The addition of a handle, though short-term negative, actually increases the likelihood of a bullish outcome and moves the pivot from the left-side apex of the cup to the right-side apex. A different pivot required an adjusted price target.
This is what we are looking at a week later:
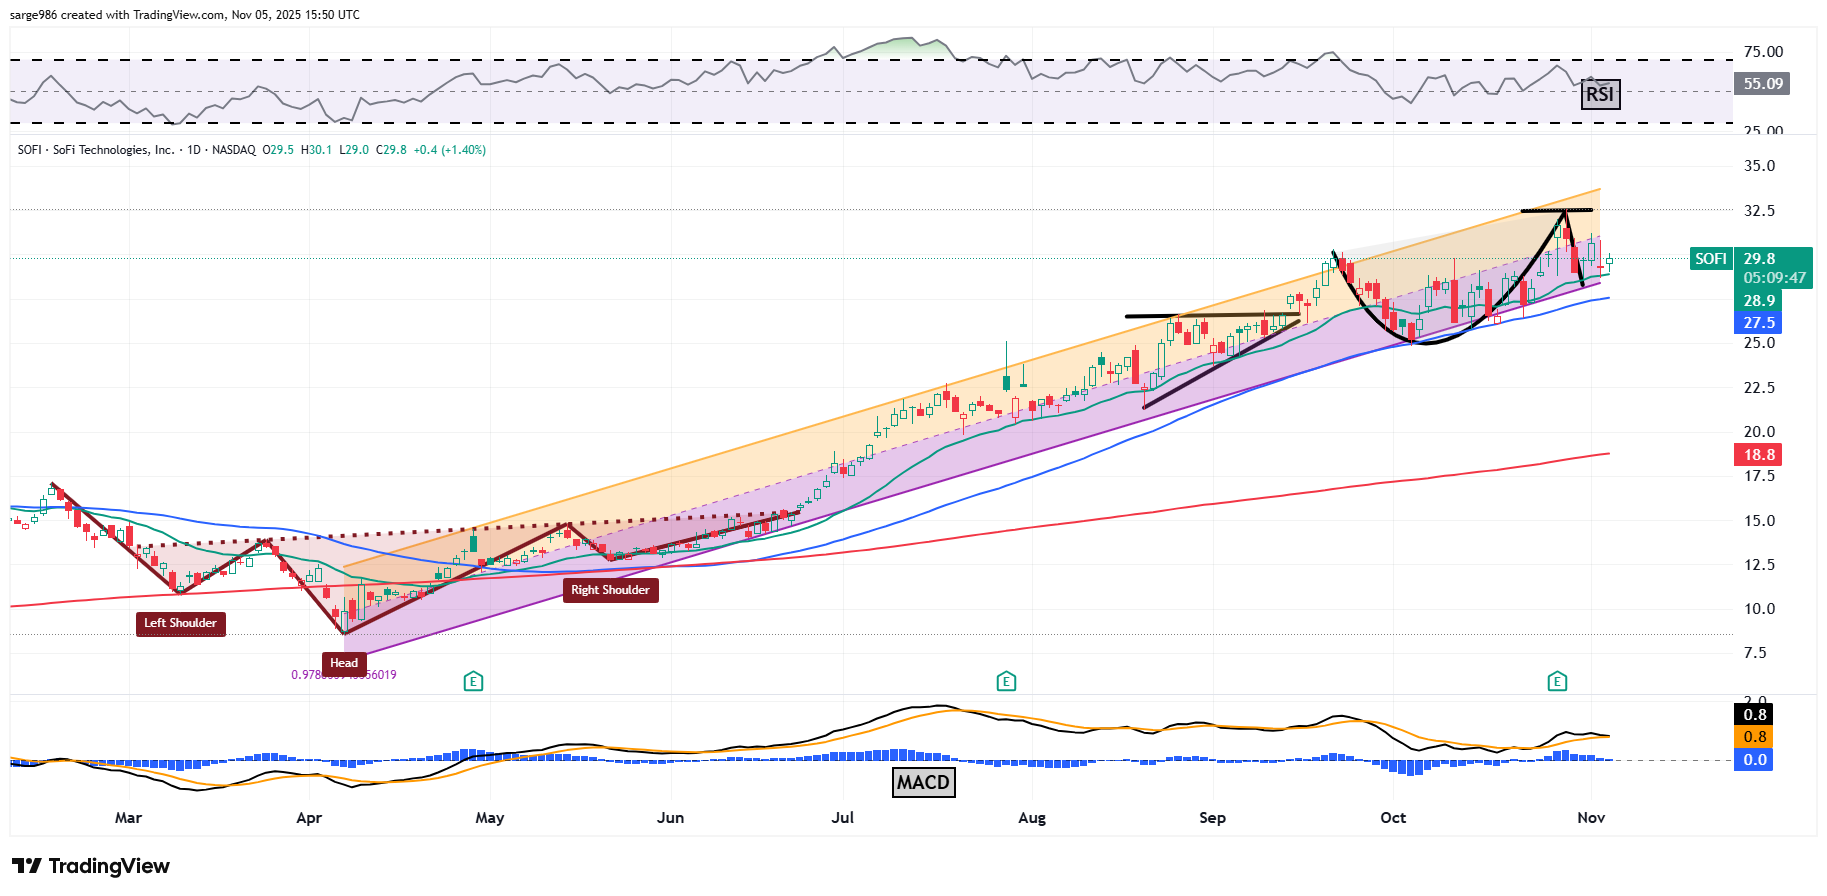
Such a subtle difference, correct? I have my eyes on the daily moving average convergence divergence (MACD), which is threatening to cross the 12-day exponential moving average (EMA) below the 26-day EMA and also threatening to drop the histogram of the 9-day EMA into negative territory. These would be short-term bearish developments. They could also be signaling that the depth of the handle will have to test the stock's 50-day simple moving average (SMA) instead of the 21-day EMA. That won't change my new pivot unless we have a serious breakdown.
SoFi Technologies (SOFI)
Price Target: $40 (up from $37)
Pivot: $32 (up from $30)
Add: At the 50-day SMA (currently $27.50)
Panic: Loss of the 200-day SMA (currently $19)
At the time of publication, Guilfoyle was long SOFI equity.
