New Rocket Lab Price Target as Upside Pivot Is Decisively Taken Out
Here we go again, even as the stock is not totally out of the woods.
You've reached your free article limit
You've read 0 of 1 free Pro articles.
That was quick.
It was less than a week ago. Wednesday, December 3, to be exact. I then updated my take on core "Stocks Under $10" portfolio holding and core Sarge-folio holding Rocket Lab USA (RKLB) for our subscribers.
The stock was off of its lows. The last sale was $42.70. Using the 21-day exponential moving average (EMA) as my pivot I put a $51 price target on the shares.
Well, the shares closed that Wednesday up 6.7% and closed the next day up 10.4%. Yesterday, Monday, December 8, Rocket Lab traded as high as $52.37 and closed at $51.56.
News? Nothing company specific. Swing trading and momentum trading vehicle? Definitely.
Keep in mind, earnings are not due until late February, so that's not really an issue just yet. Currently, Wall Street is looking for annual sales growth of roughly 34% and a GAAP loss per share of $0.10, in line with the year-ago period, but adjustable to a loss per share of $0.05.
Not Out of the Woods
I wrote last week that the stock's upside pivot was its 21-day EMA, which has been decisively taken out. That's the level that often engages the swing crowd, which is important to this stock in particular. That put our target price at $51. I also wrote at that time that it would be the 50-day simple moving average (SMA) that would matter more should something like that take place.
Readers will see in the chart below that the recent rally, sharp as it has been, while forcing us to increase our price target today, also plays into the underdeveloped head-and-shoulders pattern that we have been discussing. While we enthusiastically up our target, we remain fully cognizant of the fact that this is a potentially bearish setup.
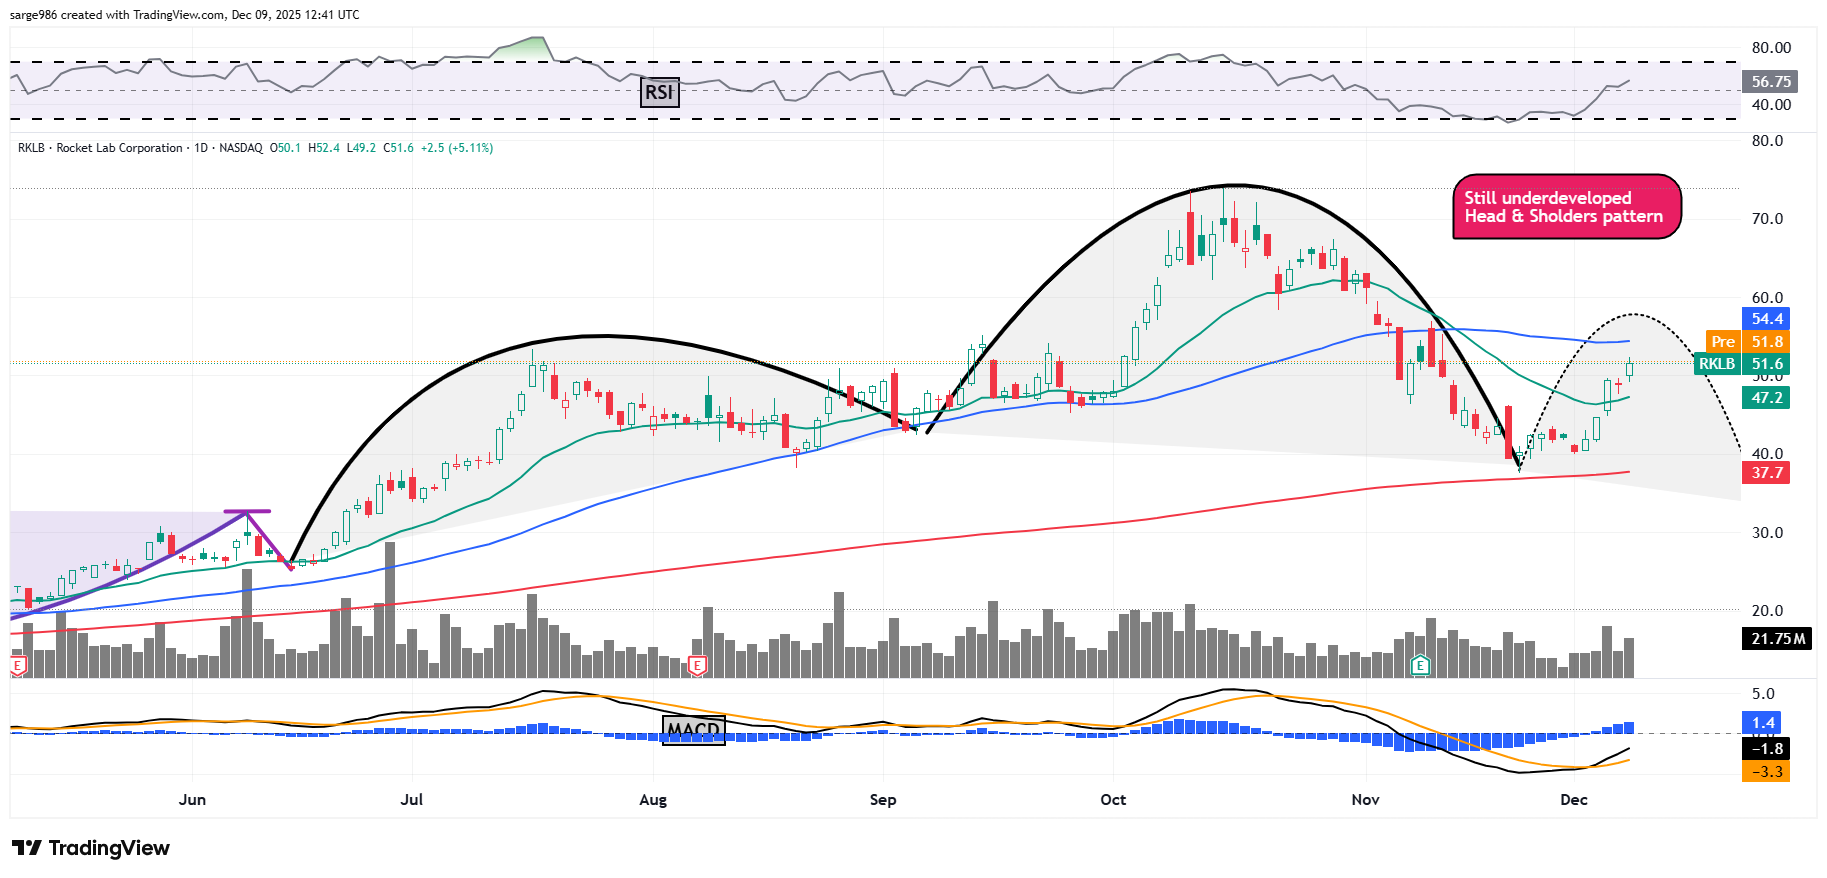
The bulls will note that relative strength has moved back into "better than neutral" territory for the first time in more than a month while the daily moving average convergence divergence (MACD) also looks better than it did.
The histogram of the 9-day EMA had moved back in positive territory, which is indeed a short-term bullish signal. Additionally, while both of these lines remain well below the zero-bound (which is a bearish signal), the 12-day EMA has now moved substantially above the 26-day EMA (which is a medium-term bullish signal).
Price Target: $65 (Here we go again!)
Pivot: 50-day SMA (currently $54.39)
Add: Down to 200-day SMA (currently $37.70)
Panic: Loss of 200-day SMA.
At the time of publication, Guilfoyle was long RKLB equity.
