New Rocket Lab Price Target as Buyers Signal Key Support
We're providing updates on the aerospace firm as well as Palantir and SoFi Technologies as the stocks develop.
You've reached your free article limit
You've read 0 of 1 free Pro articles.
Regular readers already know that I added to my long position in Palantir Technologies PLTR on Wednesday as the stock ran into a deep hole. Fortunately, the stock rebounded intraday and closed up significantly from where those additions were made. Readers also know that, due to some position "right-sizing" and a significant redemption, I had made sales the week before last at an average price of $185.60. So, even with the recent volatility, we're in good shape. I have left plenty of room to add more shares if I have to and if it makes sense technically.
Because we have been so focused on managing the position in Palantir, readers are likely less aware that I have gone through the same motions in managing two other key "Stocks Under $10" holdings. I took profits in both SoFi Technologies SOFI and Rocket Lab RKLB last week for the same two reasons, leaving them still among my heaviest weighted exposures. I also added to both of those names on Wednesday when the entire world was on fire.
I have not had time to touch base on those two names for you, my loyal readership until now. So, let's do that.
SoFi Technologies (SOFI)
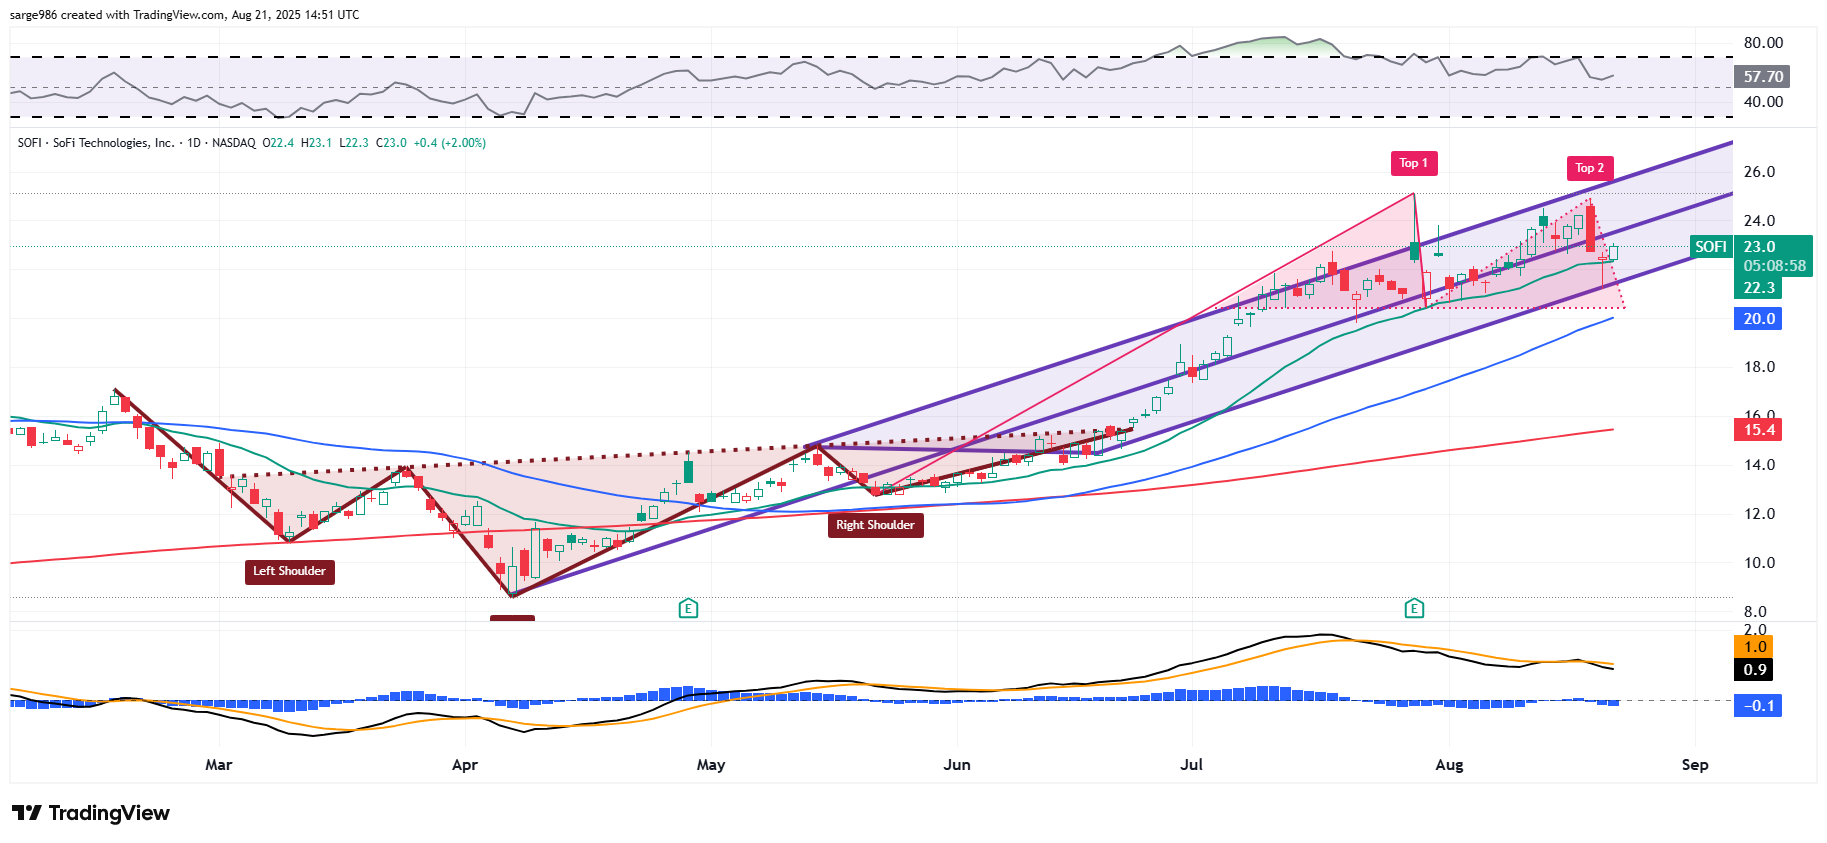
Readers are familiar with the Andrews' pitchfork model that we added to the breakout from our inverted head-and-shoulders pattern this past spring.
The shares then continued to adhere to the upward trend illustrated by the Pitchfork until late July. Then, the middle trendline was tested, and then the lower trendline. On Wednesday the algos kicked in right at that line. The stock appears to have retaken its 21-day EMA, which is key to keeping the swing crowd onsides.
Now, interestingly, in doing all of these calisthenics, the stock created a double-top pattern of bearish reversal from July into August with a downside pivot of $20.50. More realistically, the 50-day SMA is probably the line where the sell-off either accelerates or the cavalry shows up in the form of institutional investment. It is very rare that we have a bullish pattern (the pitchfork) and a bearish pattern (double top) co-existing on one chart at the same time where neither one has yet broken.
As for my indicators, relative strength remains better than neutral and is no longer close to being in a technically overbought condition. The daily MACD has clearly grown more bearish looking. The histogram of the nine-day EMA has dropped below zero while the 12-day EMA crossed below the 26-day EMA. That said, the nine-day EMA is barely negative and the 12- and 26-day lines are both in positive territory.
In short, this chart is not so bad, and the levels are clear.
Target Price: $29 (reiteration)
Pivot: $25 (recent high)
Add: Between the 21-day EMA and the 50-day SMA
Panic: Loss of contact with the 200-day SMA
Rocket Lab (RKLB)
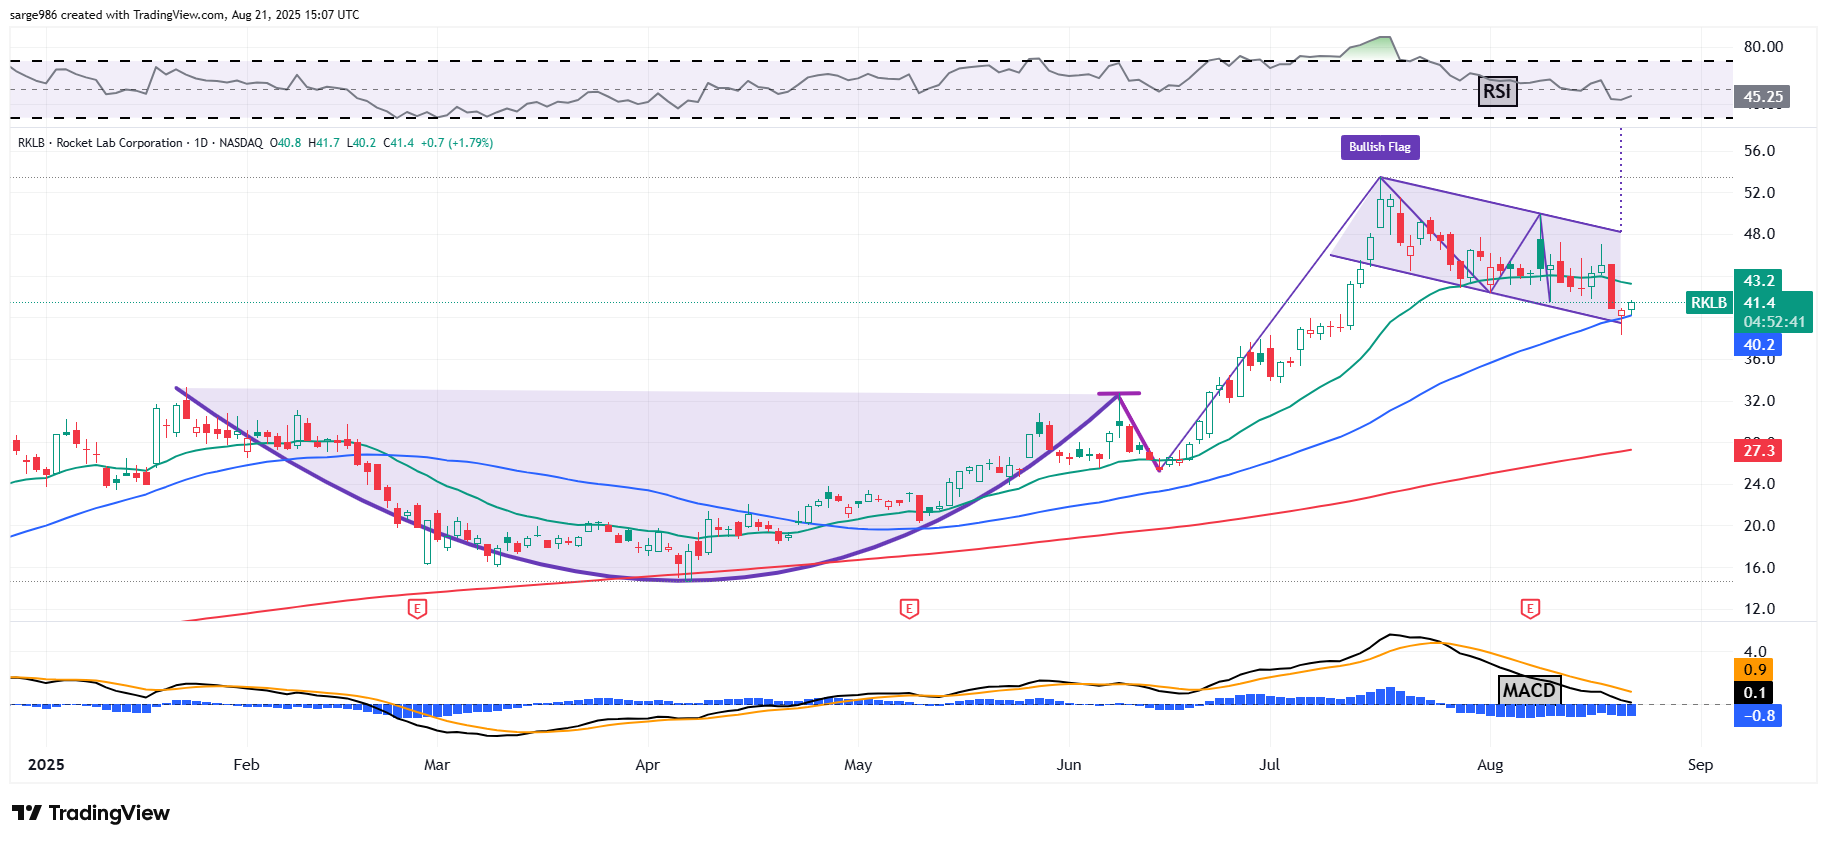
Right now, I am cautiously excited about this name. Readers hopefully can recall that on August 8, I wrote an alert informing them that I was reducing exposure to this name. The high that day was $49.92. I canceled my immediate target price at that time and told readers that I would be waiting for the stock to approach its 50-day SMA, which is exactly what I did. Readers will see that RKLB lost and took back its 50-day line on Wednesday.
What has me excited is the apparent bull flag pattern of trend continuance that has developed over the past six weeks or so. This is a signal, especially if the 50-day line holds, that the buyers have right-sized and are willing to support the stock here. Obviously losing that line would be sub-optimal.
The stock's reading for relative strength is now slightly below neutral. The daily MACD is still postured bearishly. We'll have to see if either the 12-day EMA or 26-day EMA can avoid entering into negative territory. The bull flag and the 50-day line are the keys.
Target Price: $55 (new)
Pivot: Upper trendline (currently $48)
Add: At the 50-day SMA
Panic: On loss of the 200-day SMA
At the time of publication, Guilfoyle was long PLTR, SOFI and RKLB equity.
