New Price Target for SoFi as Swing Traders Make a Move
The financial services firm has developed a new pattern in the stock chart.
You've reached your free article limit
You've read 0 of 1 free Pro articles.
It's been a little while since I have updated core "Stocks Under $10" holding SoFi Technologies SOFI for our readers. The last time we touched upon this name was the morning of April 29.
SOFI had just reported the firm's first quarter financial results. The firm's top- and bottom-line numbers had both easily beaten Wall Street's expectations. Revenue growth was good enough for a year-over-year gain of 32.8%.
Within the firm's segments, Financial Services had generated revenue of $303.119 million (+101%) as net interest income increased 45% to $173.199 million and non-interest income increased 321% to $129.92 million. Impressive. Segment profit contribution increased an incredible 299% to $148.332M as segment contribution margin improved from 25% to 49%. Things were certainly looking up.
On guidance, SoFi Technologies increased its full-year revenue projection from $3.2 billion to $3.275 billion to $3.235 billion to $3.31 billion, implying annual growth of 24% to 27%. Full-year GAAP EPS was seen at $0.27 to $0.28, up from prior guidance of $0.25 to $0.27. For the second and still current quarter, net revenue was seen at $785 million to $805 million, resulting in a GAAP EPS of $0.05 to $0.06. That took the midpoint of that guidance above what was the consensus view at that time for top- and bottom-line performance.
Still, the Stock Waffled
Some readers may remember this chart that I drew up for you at the time:
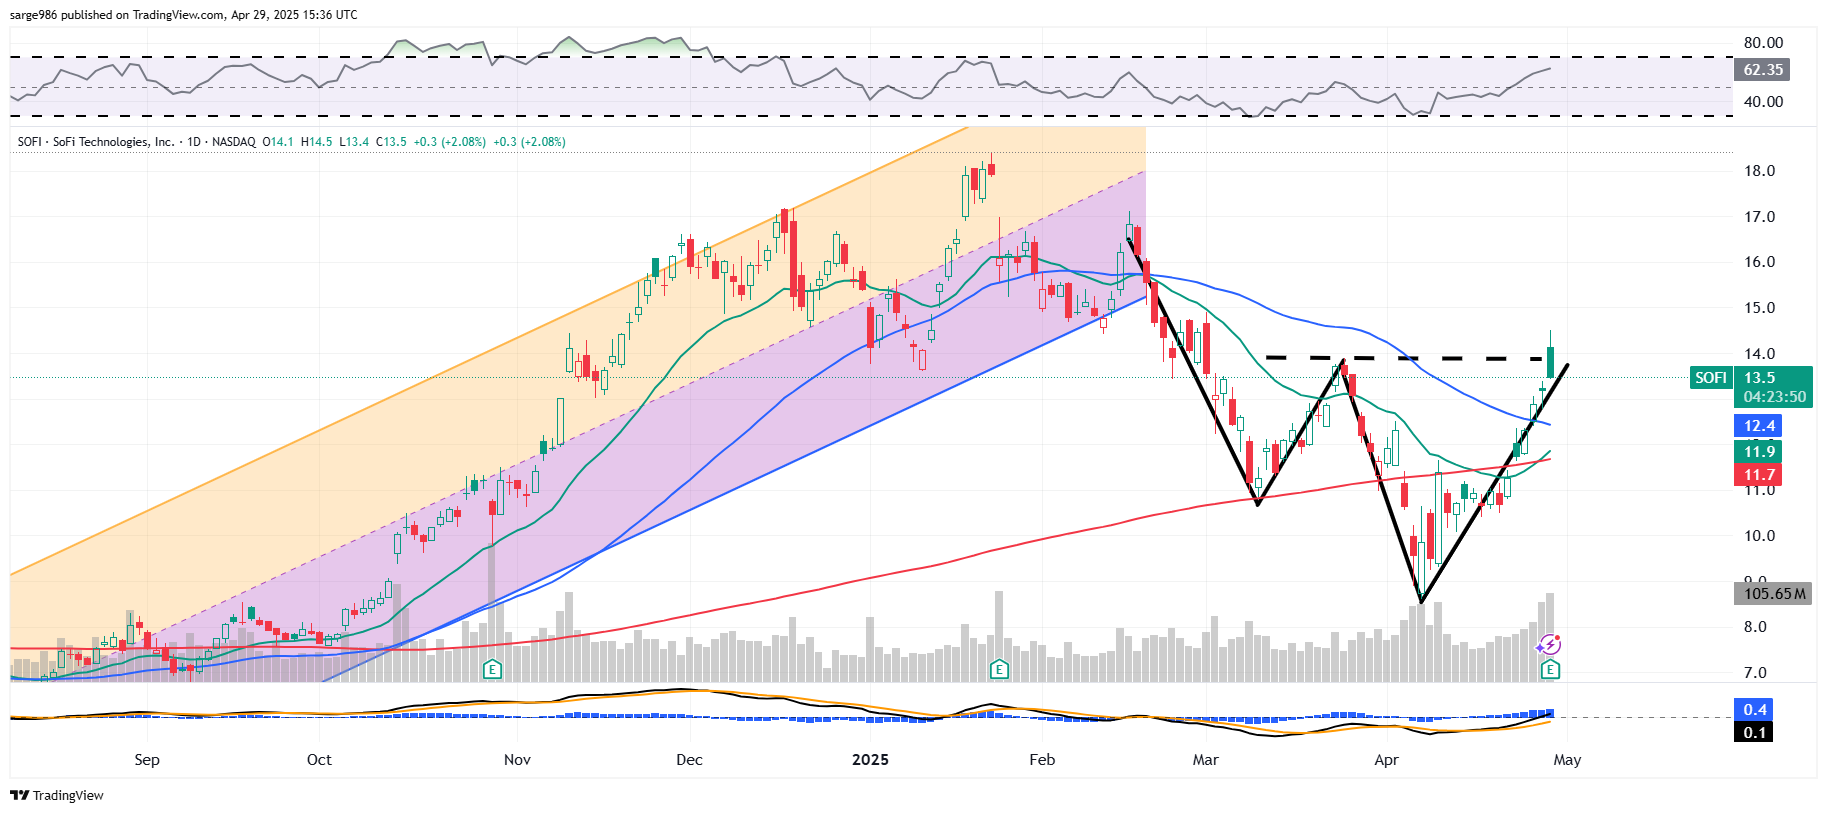
All systems go. Target price of $18.50, based on a $13.90 pivot. Just one thing. Shortly after what I had then thought might be a breakout, the stock struggled. Little did I realize at the time that SOFI was further developing what I had seen as a double-bottom pattern of bullish reversal and creating something that at least technically, looks even more bullish. Check this out...
New Pattern
What I had then seen as a double-bottom was actually the left shoulder and the head of an inverted head-and-shoulders pattern (also of bullish reversal) with a $14.80 pivot or neckline. So, still a month and a half away from earnings, what are we looking at? Let me show you:
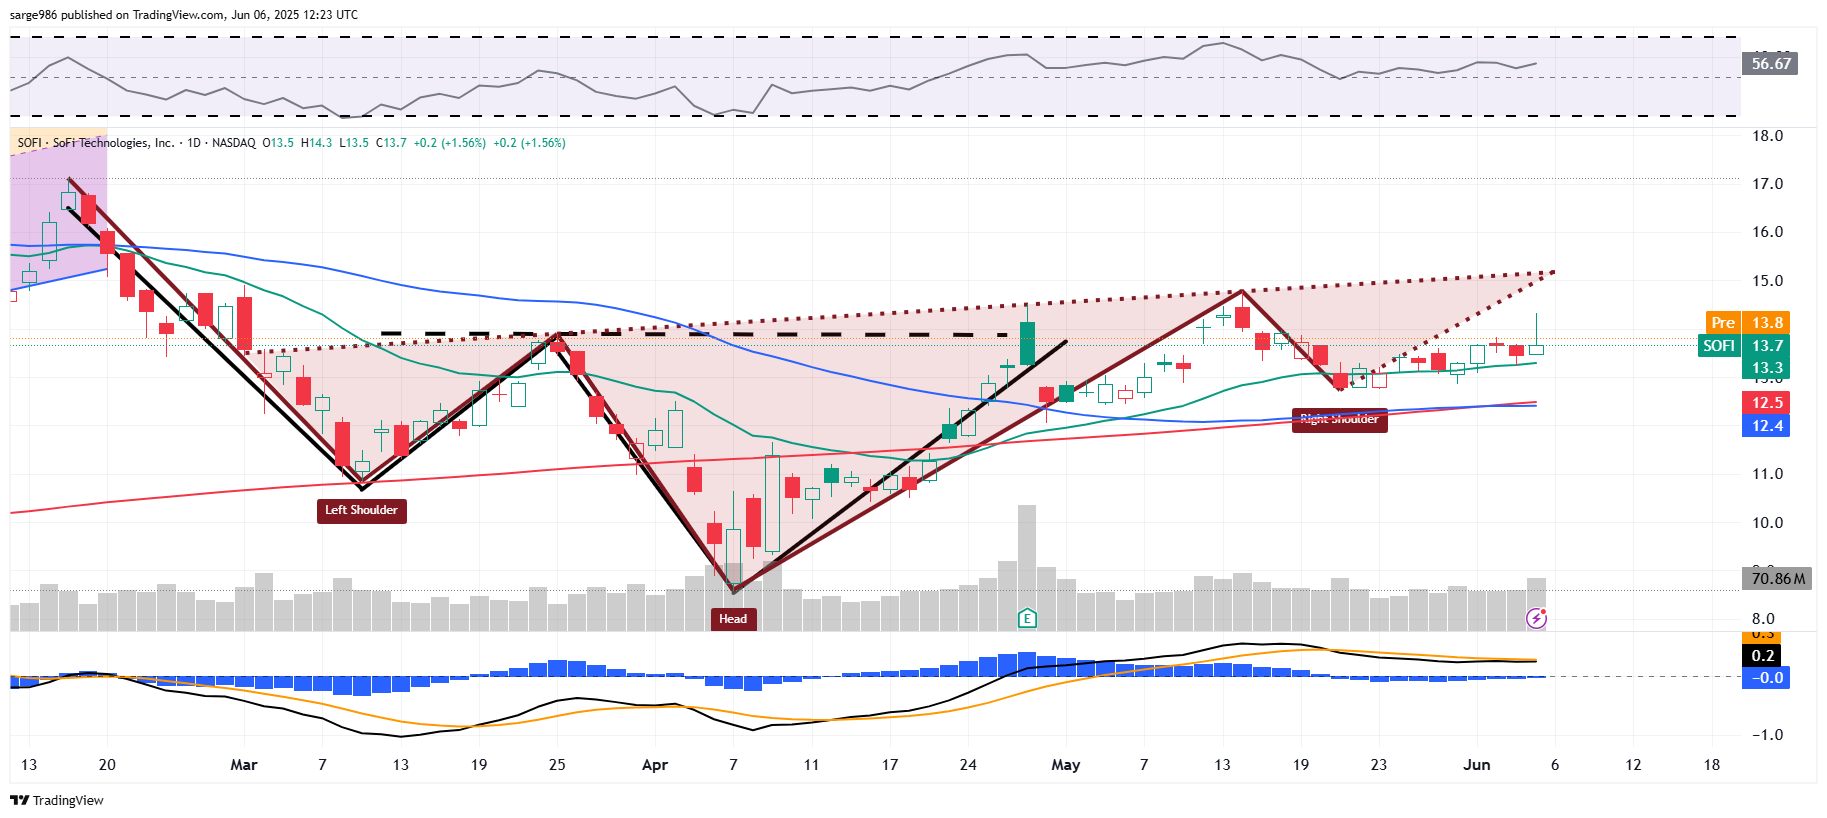
Note that SOFI has found support on weakness at its 21-day EMA, which involves far more swing traders than it would portfolio managers. Managers have not been tested. Yes, the 50-day and 200-day SMAs have been crossing regularly, which kind of negates any algorithmic impact that might have been caused by either a golden or death cross.
Relative strength is neutral to better than neutral right now, while the daily MACD sends mixed messages. The histogram of the nine-day EMA is negative, but less negative than it has been. As for the 12-day EMA and 26-day EMA, right now the 26-day line has the upper hand, but those two lines are really running alongside each other.
New SOFI Game Plan
Target Price: $19.25 (up from $18.50)
Pivot: $14.80 (up from $13.90)
Add: Down to the 200-day SMA (currently $12.50)
Panic: Loss of contact with the 200-day SMA
At the time of publication, Guilfoyle was long SOFI equity.
