New Price Target for SoFi After a Spectacular Move
SOFI's been rocking. We adjust.
You've reached your free article limit
You've read 0 of 1 free Pro articles.
On June 16, just about two weeks ago, we wrote to 'Stocks Under $10' readers concerning SoFi Technologies SOFI. The stock had closed at $14.09 the night prior and had started to move sideways after rallying off of an $8.60 low in April and a dip in mid-May that bottomed at $12.74.
We reiterated our $19.25 target price in that mid-June piece and informed readers that what we had seen as a Double Bottom pattern of bullish reversal earlier in the month had developed into an Inverted Head & Shoulders pattern. This, of course, is also typically a bullish setup.
The stock had found support at its 21-day exponential moving average (EMA), suggesting that there were at least some swing traders snapping up shares when they tested that level and had come nowhere near testing the 50-day and 200-day simple moving averages (SMAs) since late April. That's where the institutional support likely would be in our thinking. We were working off of a $14.80 pivot at the time.
Spectacular Move
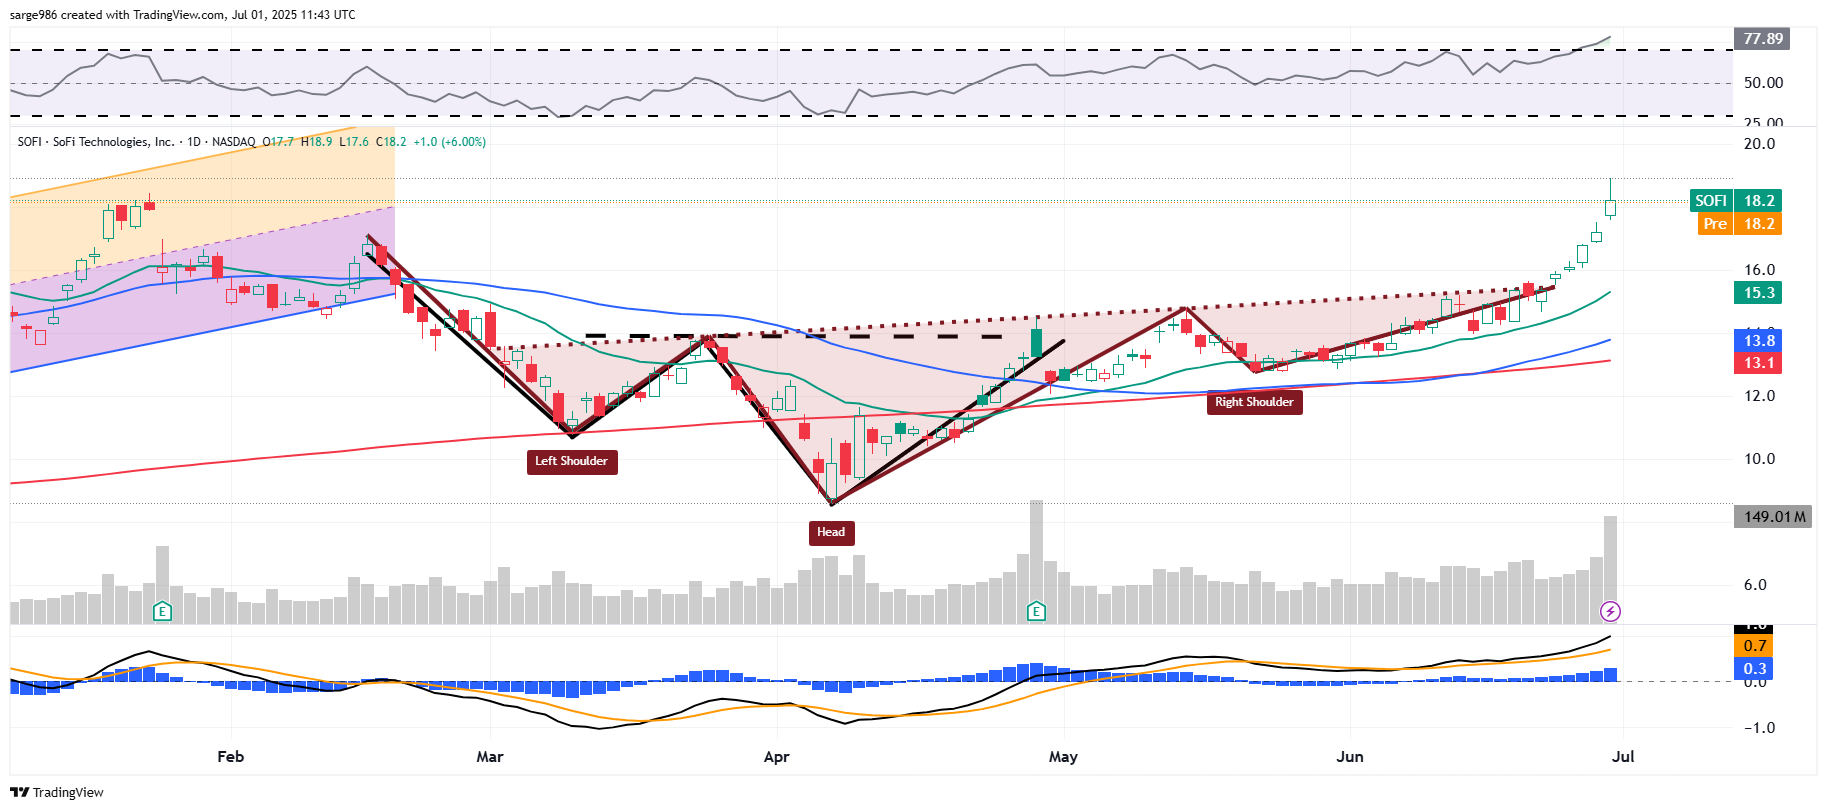
Readers will quickly see in the chart above that our Inverted Head & Shoulders pattern has worked like a charm. The stock closed on Monday evening at $18.21, which was up 6% on the session and good for a sixth consecutive "up" day with trading volume increasing each and every day during that streak from the day prior. The stock is up 29.2% since that heads up on June 16th and 111.7% since that April bottom.
Relative Strength has now moved ever so slightly into technically overbought territory, up from a neutral reading two weeks ago. The stock's daily moving average convergence (MACD) is now postured aggressively bullishly with the histogram of the 9-day EMA well above zero and with the 12-day EMA well above the 26-day EMA with both in positive territory and with the 12-day EMA apparently accelerating to the upside.
Earnings
SoFi Technologies is expected to report second-quarter financials in about four weeks' time. Right now, Wall Street is looking for GAAP EPS of $0.06 on revenue of about $802 million. This would compare well to the year-ago comparison of $0.02 per share on revenue growth of more than 34%.
Over the past thirty days, two of the seven sell-side analysts I see that cover this stick have increased their estimates for the quarter, while four have increased their full-year earnings estimates. None of the seven have revised anything lower.
Close Call, My Thoughts
On Monday, shares of SOFI apexed at $18.92, just $0.33 short of my target. Was that it? The stock is down small on Tuesday morning. I know a few readers took some profits Monday as price targets really are more like hand grenades than sniper rifles.
For those that don't understand, grenades are area weapons, while sniper rifles are tools of precision. If that's you, you are not wrong. I hope you hung onto something because I still think the shares go higher.
The neckline of the inverted H&S pattern stood at $15.40, up from $14.80 at the time it triggered this most recent leg of the rally. Therefore, our pivot and subsequently our target must be adjusted higher.
SoFi Technologies (SOFI)
Price Target: $20 (up from $19.25)
Pivot: $15.40 (up from $14.80)
Add: Down to the 50-day SMA (currently $13.80)
Panic: Loss of contact with the 200-day SMA (currently ($13.10).
At the time of publication, Guilfoyle was long SOFI equity.
