New Palantir Price Target as Stock Strength Grows
We're upping our price target for the AI darling as the charts continue to send bullish signals.
You've reached your free article limit
You've read 0 of 1 free Pro articles.
The technical case for Palantir has improved.
Again? Yes, again.
There has been no major news released concerning Sarge-folio holding and "Stocks Under $10" core name Palantir Technologies (PLTR) this week. Yet the song just keeps getting sweeter and, speaking just for me, I am happy to hum along.
Little more than two weeks ago, I wrote to you (ahead of the open on December 10) to inform readers that what was then our pivot in that stock, the 50-day SMA, had been triggered.
The stock had closed at $181.84 on December 9. The last sale that I saw on Friday morning was $194.60. That's a 7% run in half of one month. This time frame also included a little bit of a post-December 10 swoon, but that played precisely into our hands. By "our," I mean the long PLTR crowd.
You Saw This
This is the chart that I showed you on that Wednesday morning:
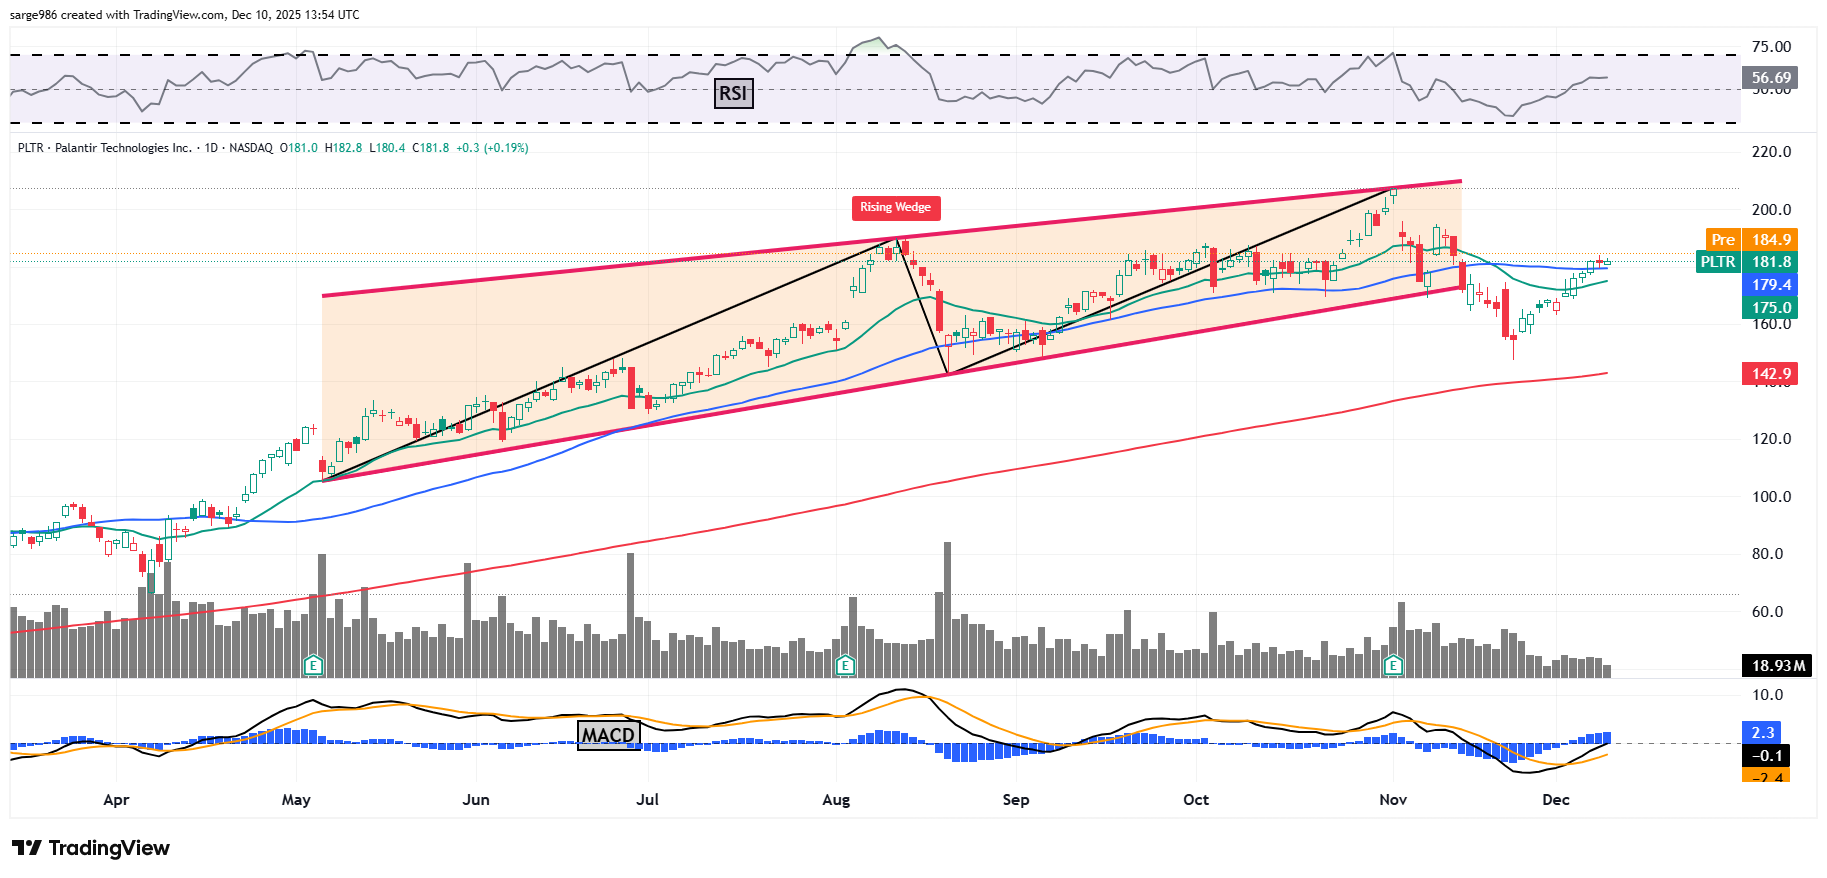
The stock had recovered from a post-rising wedge pattern sell-off and had retaken that 50-day SMA, pulling unengaged professional money back into the game. The indicators that we most often use were starting to improve as well. That morning, we reiterated our $215 target price.
Now, see this:
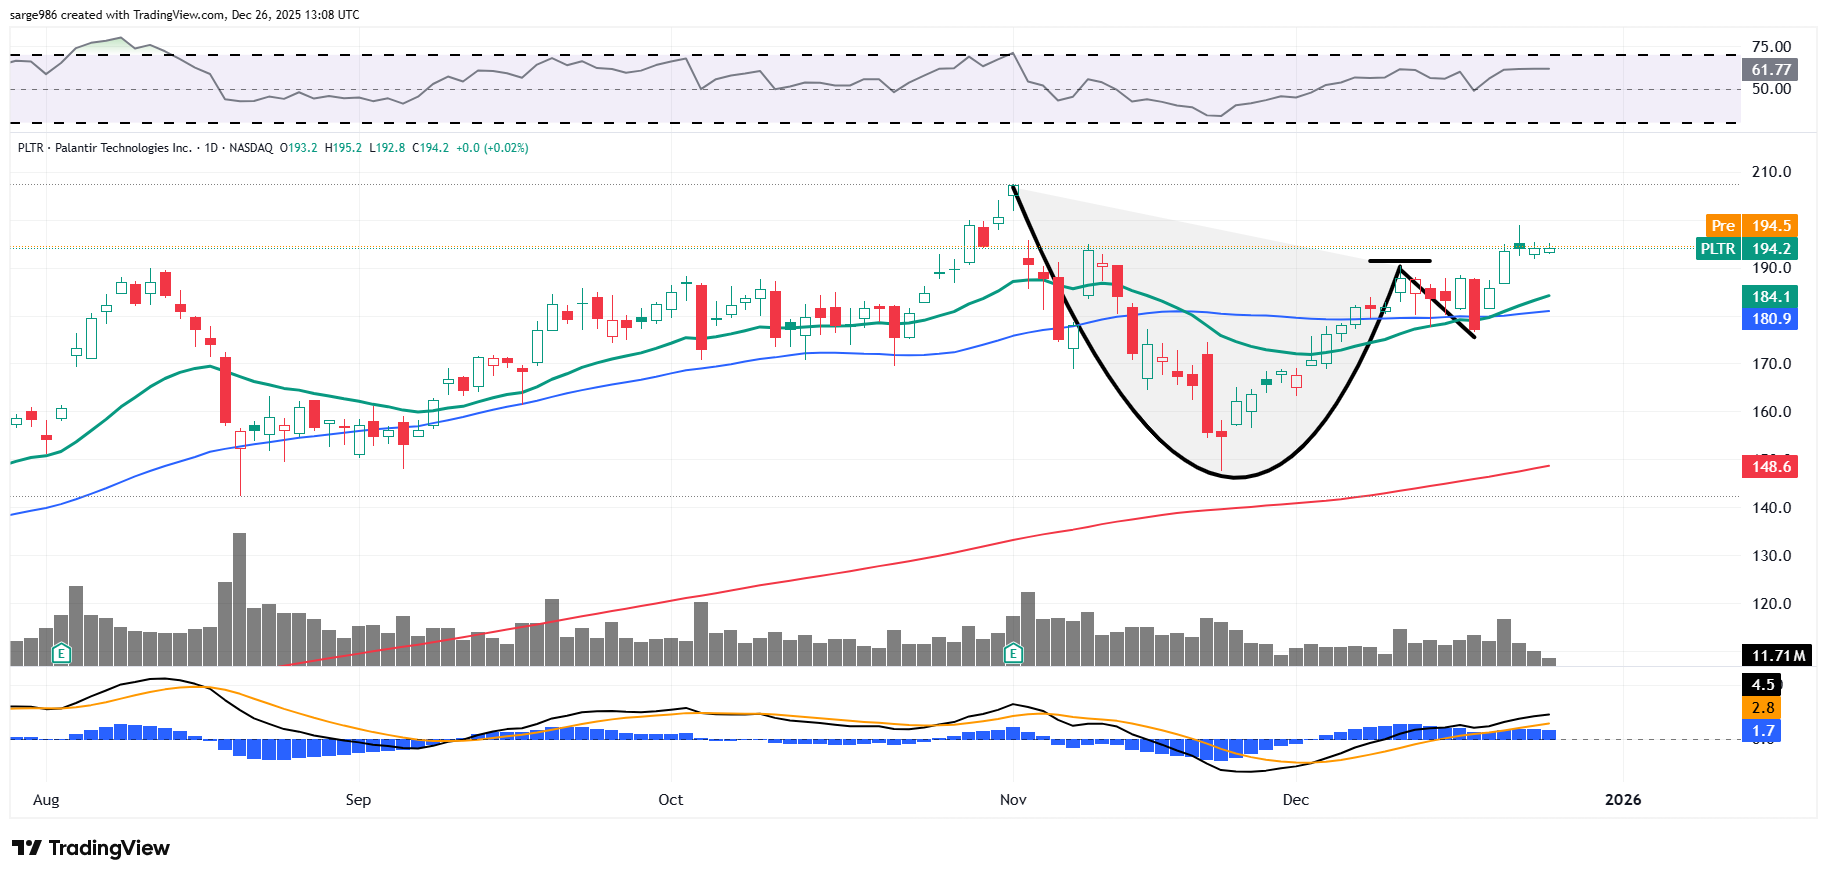
The shares of Palantir Technologies have now developed a cup-with-handle pattern of bullish continuance with a $190 pivot. As the pivot we are using rises, you know, so must our target price. The stock has also experienced a recent swing traders' golden cross (21-day ENA crossing over the 50-day EMA), which is a bullish signal, as that swing crowd has pulled the 21-day EMA away from that blue line.
Moving on to the indicators that I most often use, relative strength has improved but still lies well below entering into a technically overbought state. On top of that, looking at the daily MACD below the chart, the histogram of the nine-day EMA is now in positive territory (nearly all month) as are both the 12-day EMA and 26-day EMA, with the 12-day EMA running above the 26-day EMA. This is about the most bullish all-encompassing signal that a MACD can really send.
Target Price: $238 (up from $215)
Pivot: $190 (up from $179)
Add: Down to 50-day SMA (currently $181)
Panic: Loss of the 200-day SMA
At the time of publication, Guilfoyle was long PLTR equity.
