New Nvidia Price Target After Our Last Call Nets Major Profit
Nvidia's rally could continue to new highs, and take the S&P 500 along for the ride.
You've reached your free article limit
You've read 0 of 1 free Pro articles.
Does anyone like the sound of a 22% profit in 23 days?
That’s how much Nvidia NVDA investors have gained since we recommended buying the stock on May 6. At that time, we identified a bullish pattern that indicated it was Nvidia’s time to shine.
At the time, the stock was trading near $113. Nvidia's chart projected a rally to the $140 area. On Thursday, the stock exceeded that target, reaching $143. Admittedly, we did not expect to reach the target in less than four weeks.
This is a good example of technical charts leading fundamental news. By the time Nvidia reported earnings after Wednesday’s close, the stock had already gained over 50% since its April 7 open.
Institutions Lead the Way
That major rally is a sign that institutional investors had already determined that Nvidia was going to have a strong quarter, weeks before retail investors finally received that news. When Nvidia beat Wall Street’s estimates on earnings and revenue, The Santa Clara-based AI chipmaker raised revenue guidance despite the anticipated negative impact of U.S. export controls, particularly to China.
Now that Nvidia has reached our target, what’s next for the stock? Let’s go to the chart to find out.
Nvidia’s rally was foreshadowed by a double bottom pattern (shaded yellow). This bullish pattern was used to create our previous price target of $140.
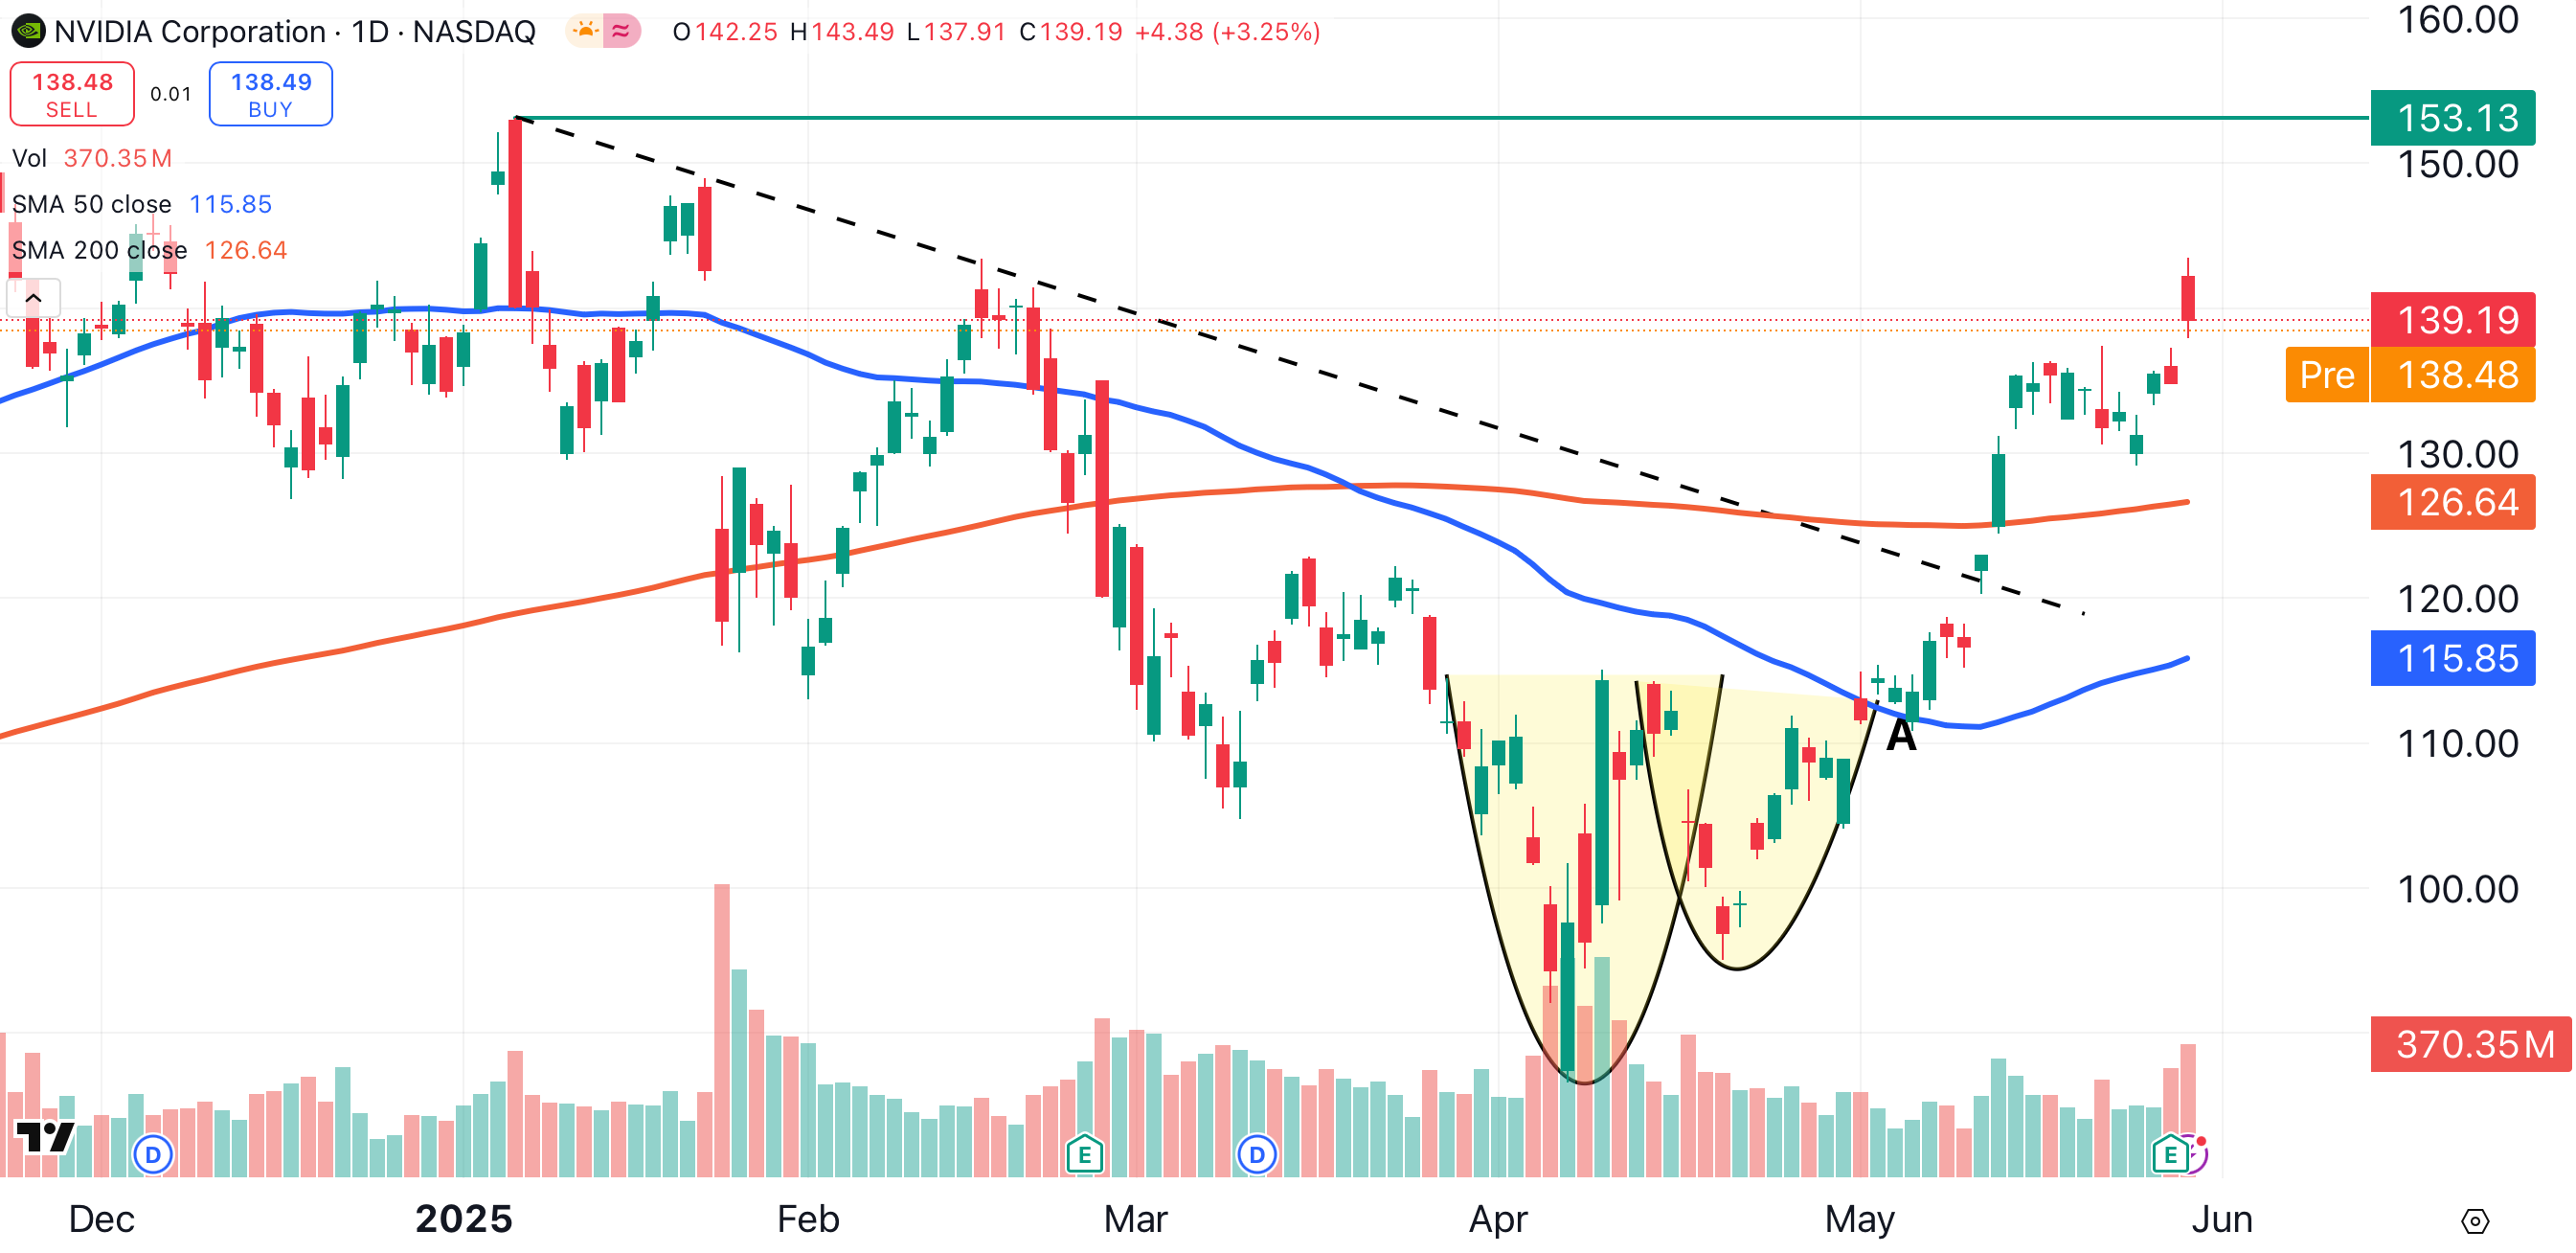
We entered our long position as Nvidia broke above its 50-day moving average (blue) for the first time since February, near $113 (point A). The stock subsequently closed above its descending trendline (black dotted line) and its 200-day moving average (red).
The only obstacle remaining on Nvidia’s chart is its all-time intraday high of $153, set on January 8 (green solid line). Above that level, Nvidia has no overhead resistance.
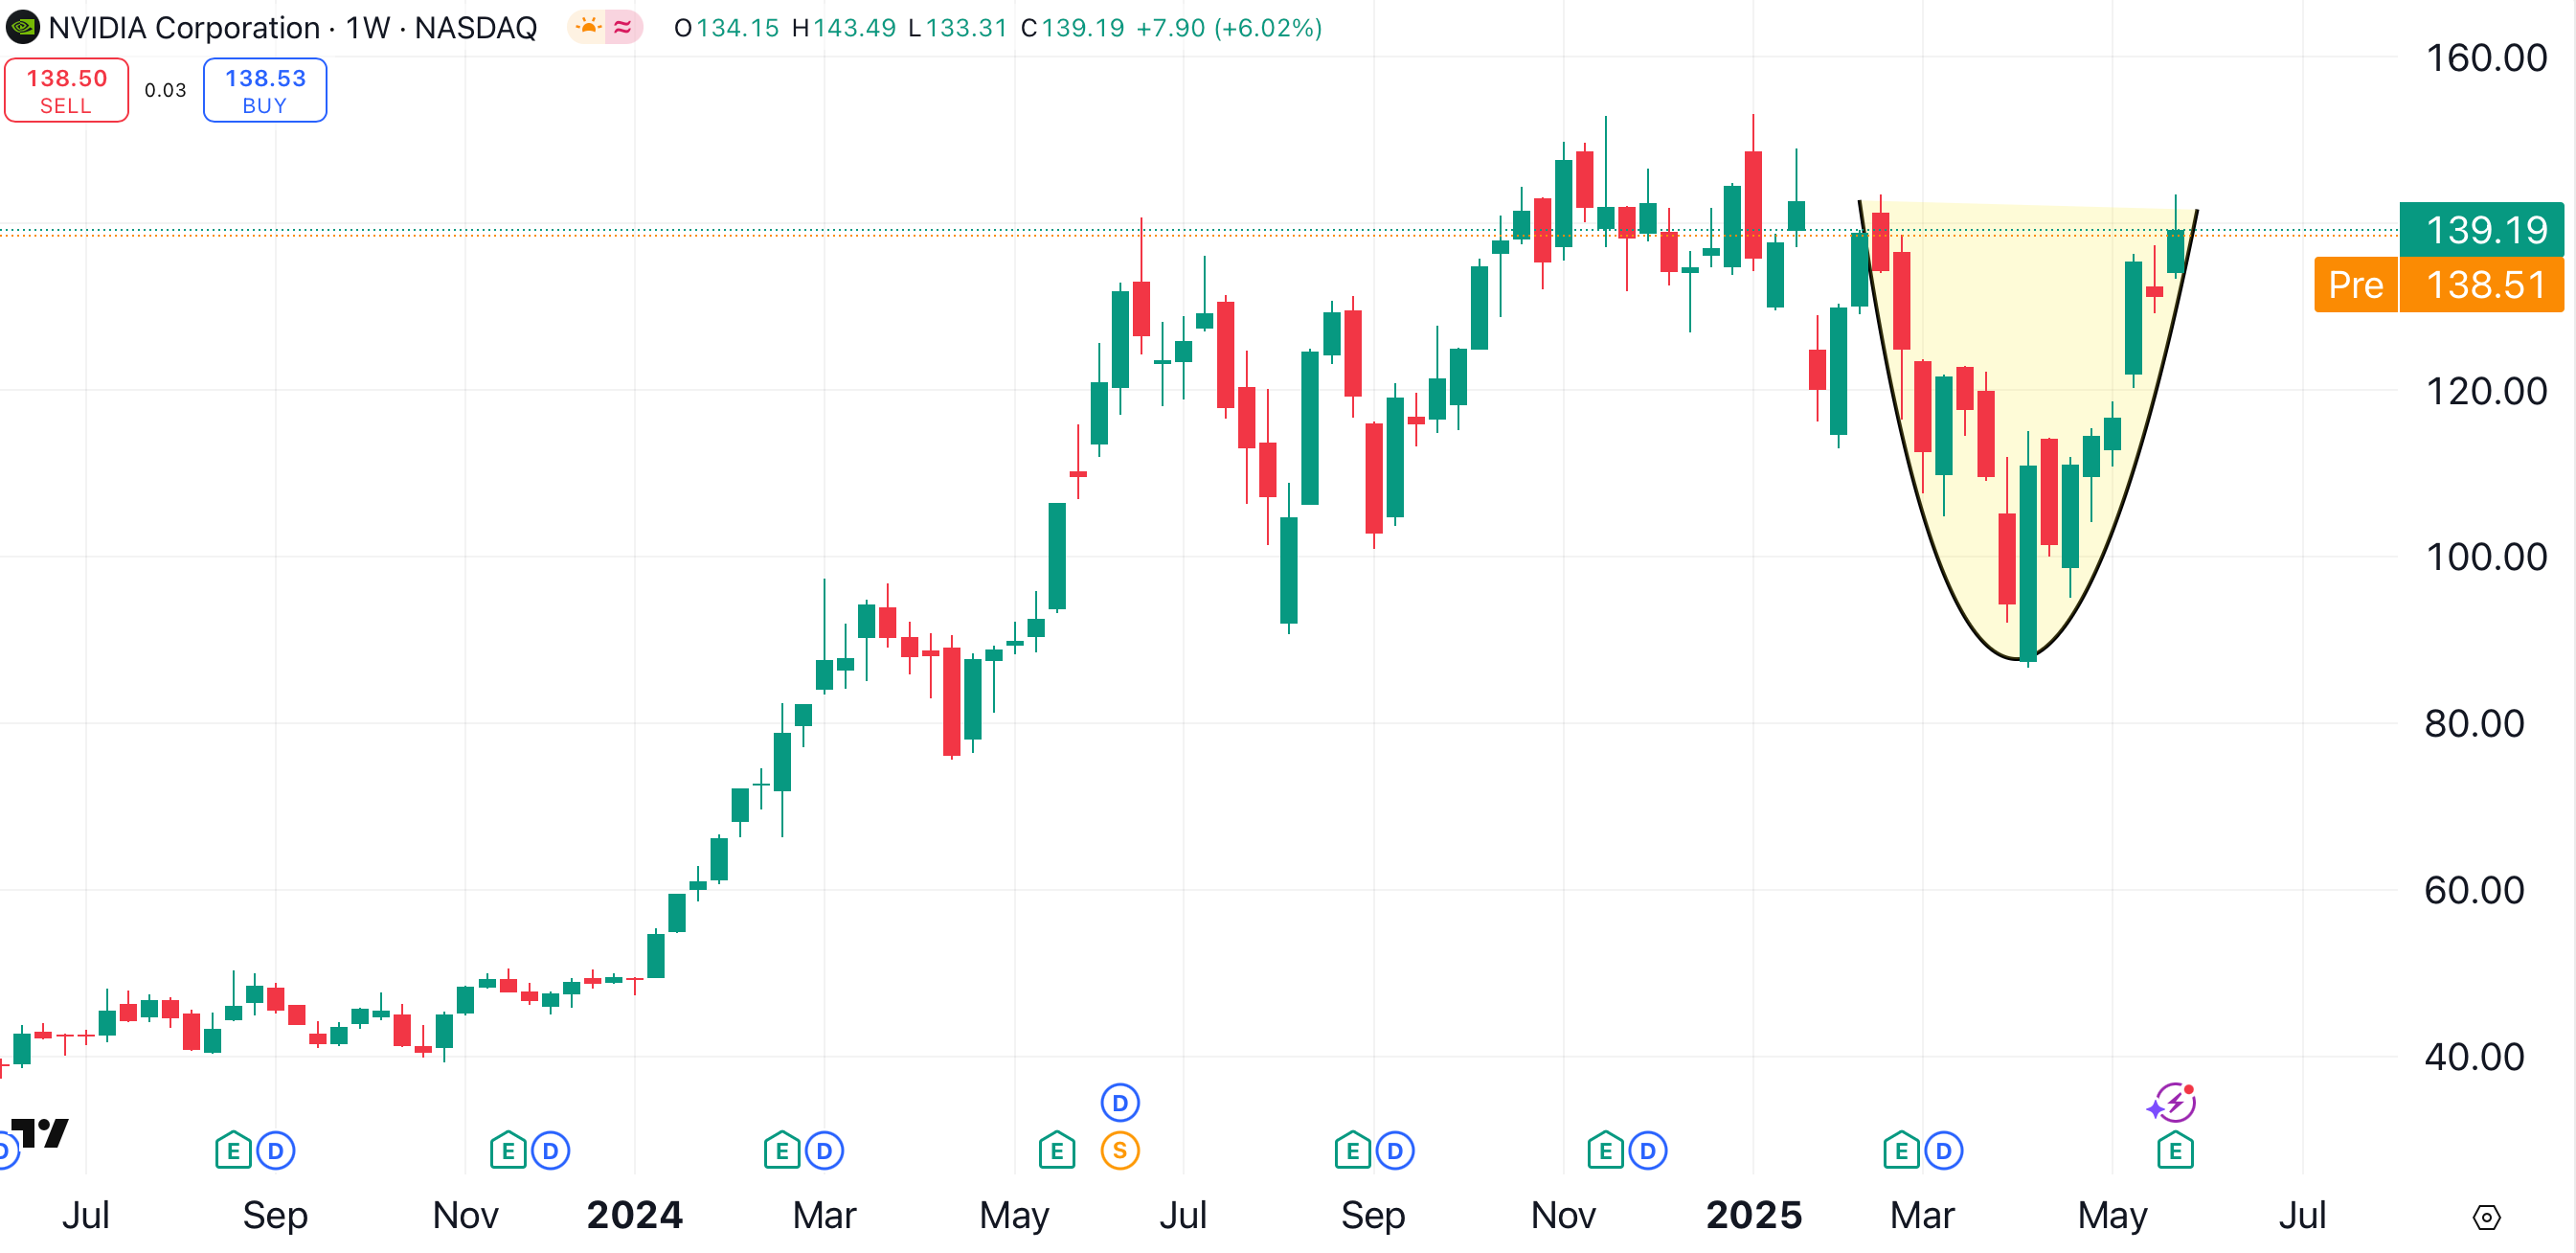
Technically, it’s difficult to set targets above all-time highs, as there is no prior price action above $153. However, if we zoom out to Nvidia’s weekly chart, a larger pattern emerges.
Starting in early February, Nvidia formed a rounded bottom pattern (shaded yellow) on its weekly chart. That bullish pattern suggests a new price target of $185 for Nvidia.
This figure is not out of line with other Wall Street forecasts. Truist Financial raised its target for Nvidia to $210 earlier this week, while analysts at Morgan Stanley upped their target to $170.
Nvidia appears to be regaining its status as a market leader. That’s good news for the S&P 500, which could soon reach all-time highs, as indicated here.
At the time of publication, Ponsi was long NVDA.
