New Highs! But Not for All.
It was the tech and software names that led the market to new highs today. Most other stocks were simply mixed.
You've reached your free article limit
You've read 0 of 1 free Pro articles.
 NYSE Trader
The Market
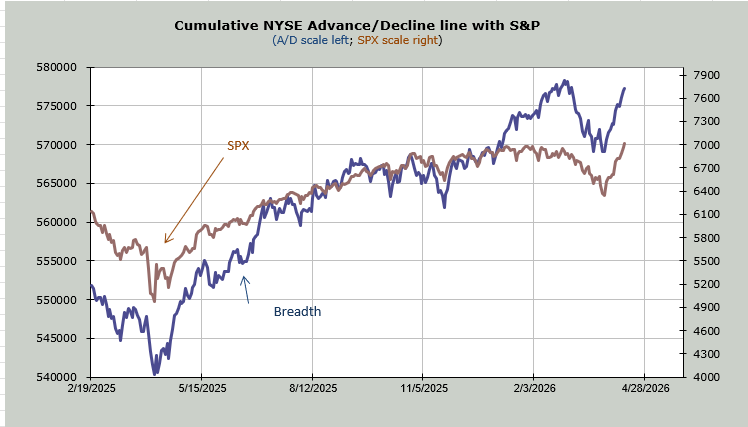
Today was a very index-mover day. We can see it clearly in the fact that breadth was barely positive on the day. Think about it, the week has mostly been about tech and the rally in those beaten down software names and the Mag 7s.
Oh, it’s not been limited to those names, but it’s been concentrated there. Most of the banks are mixed, the Utes are down, as are industrials. And while I expect the semis to take a rest here (the SOX was mostly flat today) because it is knocking up against that trendline I drew in yesterday, I think the software names remain okay to trade for now.
The S&P and Nasdaq made new highs today, but the number of stocks making new highs was terrible. The NYSE had 74 new highs. I don’t know how to spin that bullishly since there are over 3000 stocks that trade there. And last week, there were 140 new highs.
Nasdaq had 227 new highs, which is a vast improvement from where it was a few weeks ago, but Wednesday had 288 new highs and last Thursday there were 229 new highs. All that says is what was working last week is not working great this week.
Or maybe that’s just the overbought condition at work.
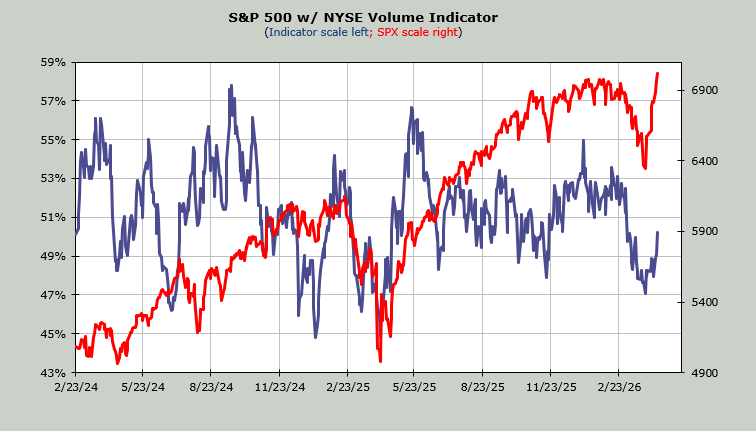
One thing that does require monitoring is that the breadth of the market did not make a new high with the S&P. This is the first time we’ve seen breadth not keeping up in a long time. It may do so in the next few days, but we began this year with breadth leading so this is a change.
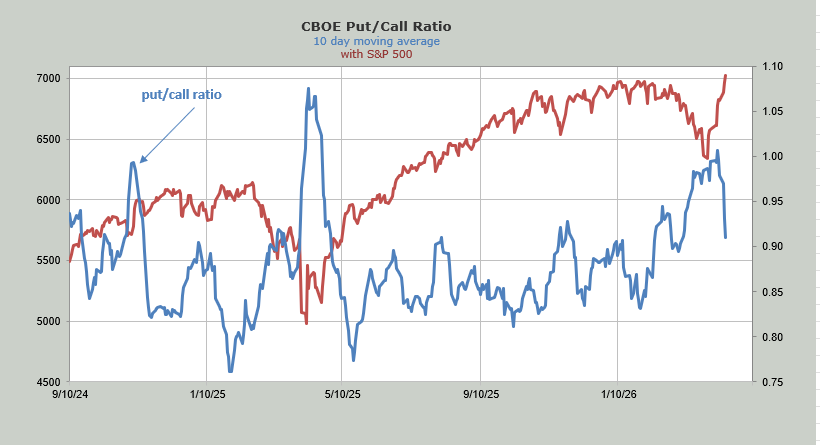
On the sentiment front, we had some interesting put/call ratios yesterday. For example the Index put/call ratio was .70. This is the lowest since December 2019. So we know there was a major sentiment shift this week. It’s not enough for me to say everyone is back in the pool in that one day does not make a market but we must monitor it for signs that the bear camp may empty out quickly. The ten day moving average is now at .91, down from 1.01 last week.
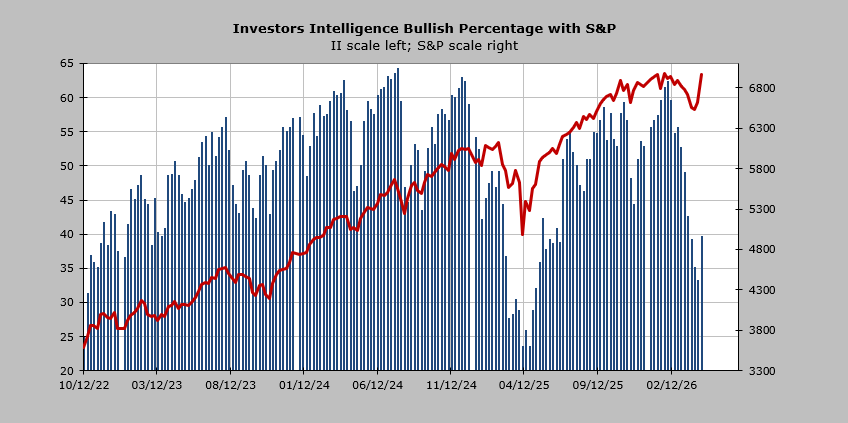
The Investors' Intelligence bulls jumped up to almost 40%, and the bears fell to 22%. Keep in mind this is the summary of newsletters written over last weekend, so I expect next week to be higher for the bulls. The ratio of bulls to bears is still only 1.7, so again, there is a shift, but it is not extreme.
I continue to think that a pullback or some chopping around should lead to another rally.
New Ideas
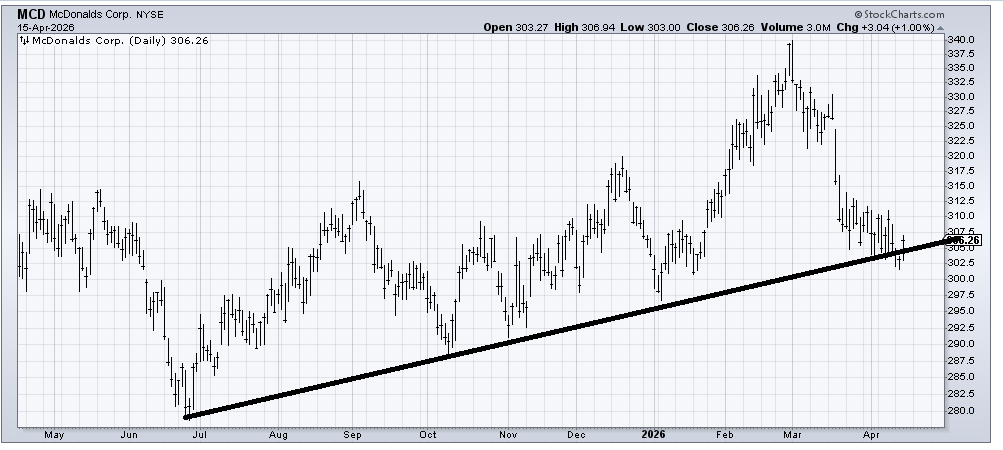
I am once again warming up to McDonald’s (MCD) . It’s holding this uptrend line by a hair, but it feels like it is trying to find some footing. It may stumble a bit more, but I think it is improving.
Today’s Indicator
The Volume Indicator finally moved! It is now 50%.
Q&A/Reader’s Feedback
Helene welcomes your questions about Top Stocks and her charting strategy and techniques. Please send an email directly to Helene with your questions. However, please remember that TheStreet.com Top Stocks is not intended to provide personalized investment advice. Email Helene here.
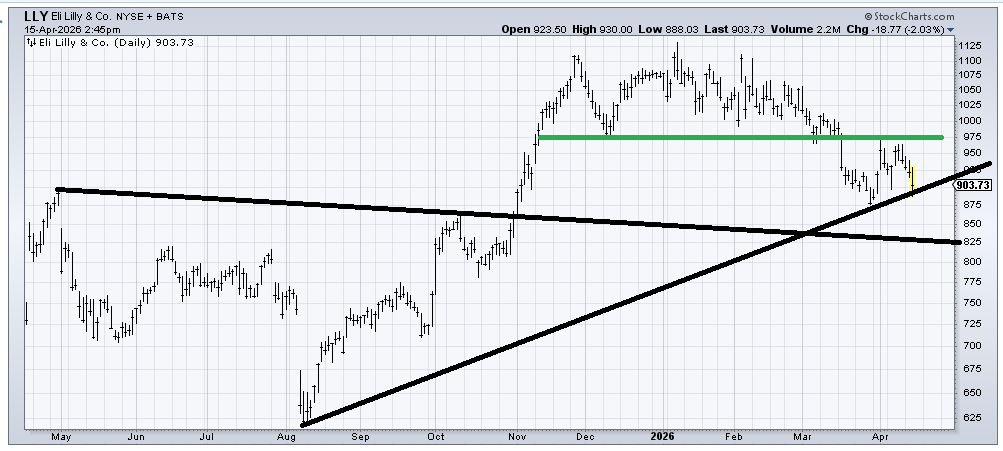
I am not currently enamored with the drugs, but I suspect I will warm up to them at some point again. Eli Lilly (LLY) has some support in this 875-900 area. I don’t have a strong sense that it will hold. But if it fell into that 825 support zone, it would meet the measured target from the breakdown of the top (green line denotes the top). I would like it. I don’t know if it will break, but if it does, I will like it.
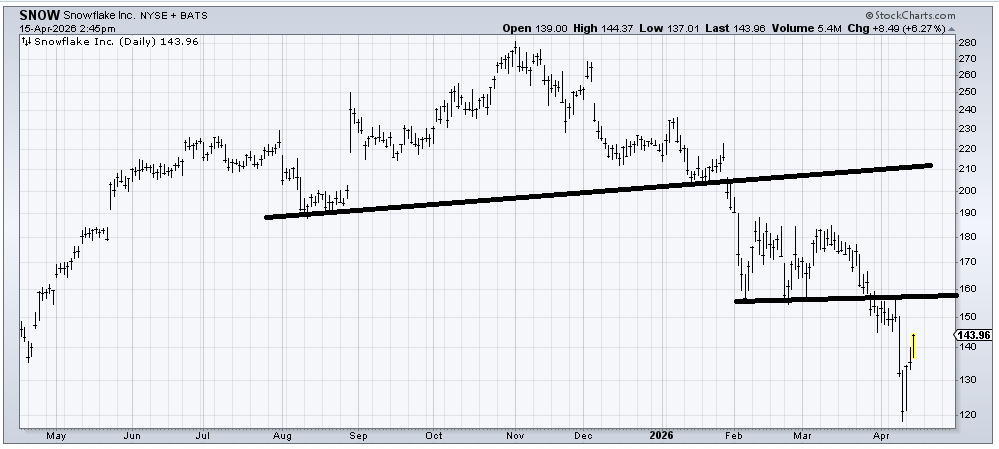
Snowflake (SNOW) hit its measured target when it got to 120 last week. It ought to start base building now. In the short term, the first resistance is in that 160 area.
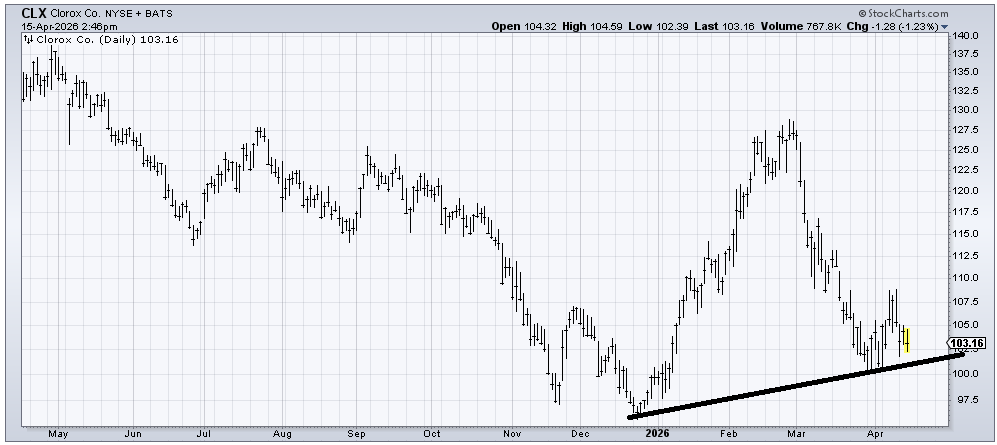
We had a great trade in Clorox (CLX) early this year, and the stock has come all the way back down. I think I would look for a bounce again in that 100-103 area.
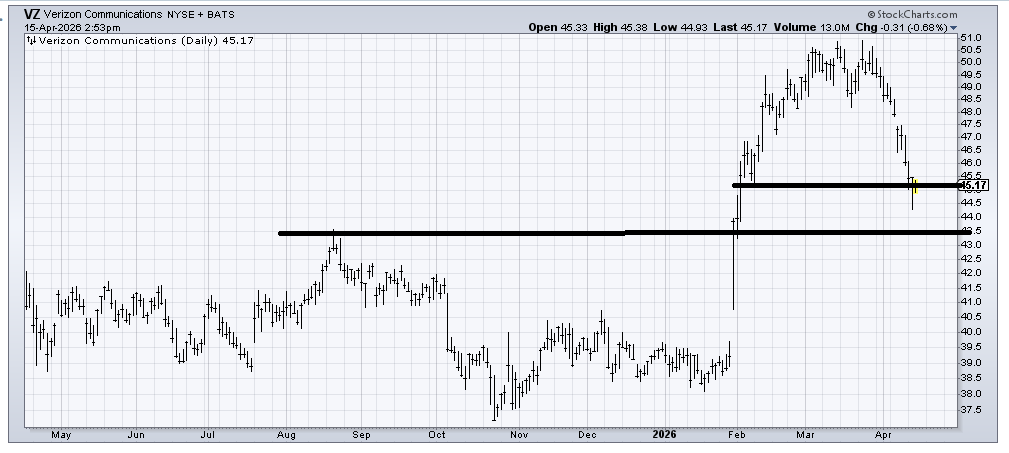
I did not like Verizon (VZ) when we looked at it a week or so ago, but it is now into some support and has met a first target. It’s certainly oversold, so I’d expect a rally, but VZ tends to have to base before it gets any traction. So a rally, but likely back down again.
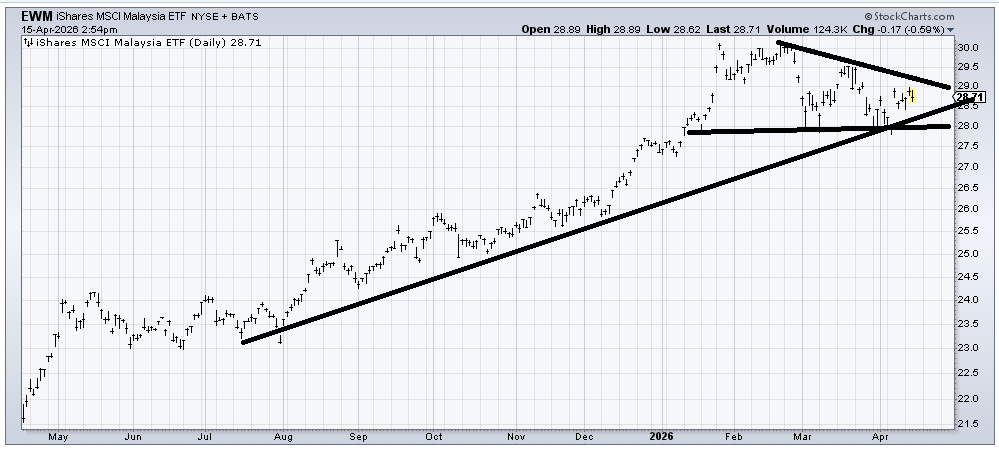
EWM, an ETF to be long Malaysia, still looks okay to me. 28 is decent support, and crossing over that 29-29.50 area would allow it to emerge from this multi-month consolidation.
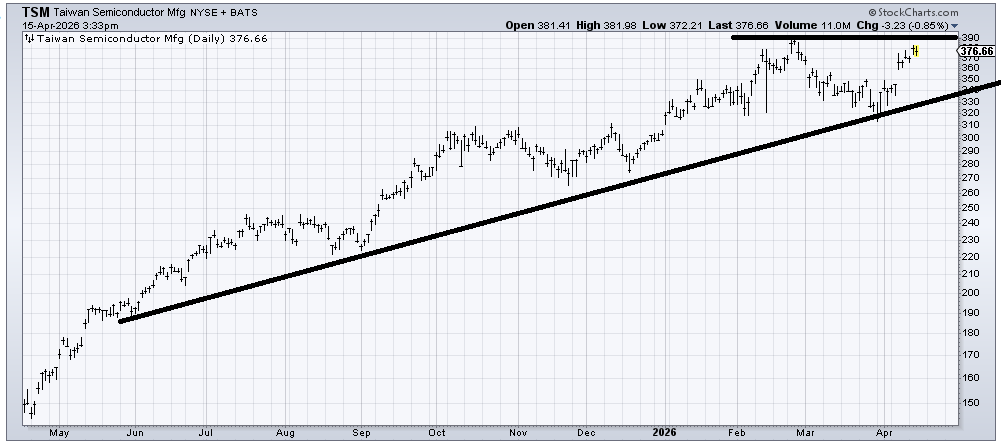
Taiwan Semi (TSM) is an okay chart, but similar to the CBOE from yesterday, I am just terrible at chasing a stock that is up like this, kissing the highs. I would like to see it pull back to 350, which would be awesome, but probably way too much to ask. But a dip of 10-15 points would at least give it a better shot at having a rest before a breakout.