Never Rationalize an Indicator, but Do Give the Market the Benefit of the Doubt
You can read the indicators, but listen to their messages without making excuses.
You've reached your free article limit
You've read 0 of 1 free Pro articles.

The Market
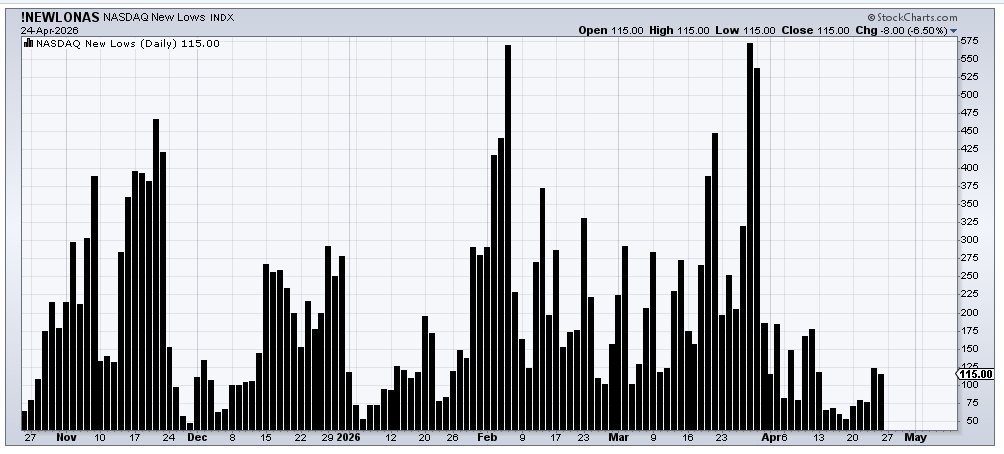
I am not a fan of rationalizing an indicator. Either we are making higher highs in the indexes with fewer stocks participating, or we are not. The new highs are currently lagging. Either we are making lower lows in the indexes with fewer stocks participating (on the downside), or we’re not. In March, the new lows on Nasdaq were contracting.
Either the McClellan Summation Index is going up (or down), or it’s not. Either we are overbought, or we’re not. And so on. I don’t need a reason as to why. I am terrible at narratives.
I am a fan of trying to give the market the benefit of the doubt when it is rallying. There was a time, decades ago, when that was not the case. But if we have learned anything from the last decade or more, it is to give the market the benefit of the doubt.
That’s why I like to wait for the indicators to roll over before I start complaining about the market on a daily basis. I like to wait for sentiment to get giddy before complaining on a daily basis. I also like the intermediate-term indicators to get overbought before complaining on a daily basis.
Often, even after we get intermediate-term overbought, the market seems to still have some upside life to it. Often, even after we see sentiment get giddy, the market seems to still have some life to it. And even after we see negative divergences, the market still has some upside left in the tank.
Each day, we get closer to an intermediate-term overbought condition. In this recent case, we started rallying about a week before we were fully intermediate-term oversold, so maybe the timing is off a bit, but the 30-day moving average of the advance/decline line has not peaked yet (that would indicate an intermediate-term overbought condition).
The Summation Index, despite needing a mere -900 advancers minus decliners on the NYSE to halt the rise, is still plodding upward. The Volume Indicator is at 53%. It gets overbought in the mid to upper 50s, usually over 55%. Can it turn down before then? Yes. But the same way I like it to get to 47% (oversold) when we are declining, I like to wait for an overbought condition on the upside. It reached 47% on the final day of March.
The sentiment indicators are mostly all knocking on the door of giddy, with a few having stepped through the doorway. So, similar to the intermediate-term indicators, they have some room for folks to get more bullish.
Does all of this mean that last week’s modest upside in the S&P felt healthy? No, it didn’t. Does the market, especially at the end of the week, feel narrow? Oh, it sure does.
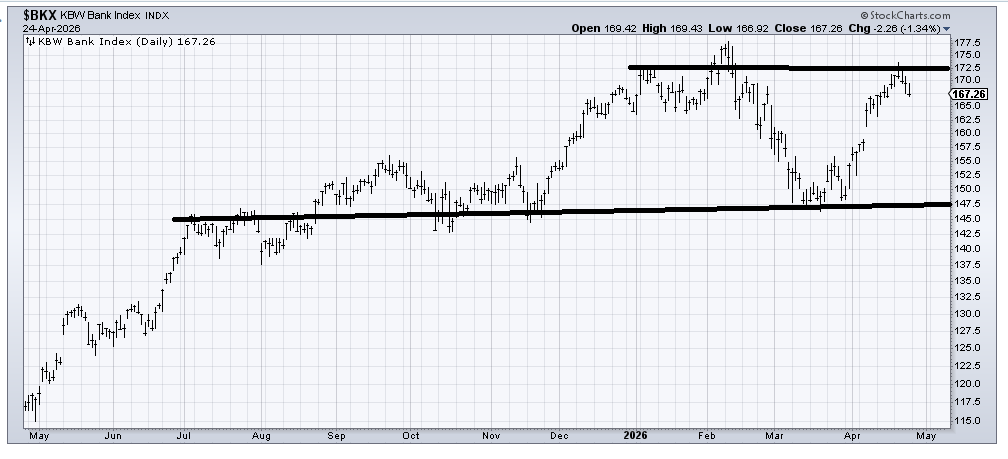
Does it bother me that the Banks can’t get out of their own way? You bet it does. Same with industrials. Same with the equal-weight S&P. Same with the Russell. Same with—heck fill in the blank. But thus far, even though there has been very little buying in so many groups for more than a week now, there has also been very little selling.
We saw some first signs of modest selling last week. For example, the number of stocks making new lows on Nasdaq has quietly risen to triple digits again. We saw the Transports, thanks to CAR, give up a massive chunk of what it had gained. While everyone is watching—marveling really—the Semis and their gazillion-day upside streak, I am very focused on the banks.
The Bank Index was unable to make a higher high on this run, and last week it fell three percent, and no one even cared. Friday saw the Bank Index close at the low. So rather than fuss over when the semis might finally see a red day—I’ve done that before and been burned—I am going to focus on watching the banks to see if last week’s selling gets more aggressive.
New Ideas
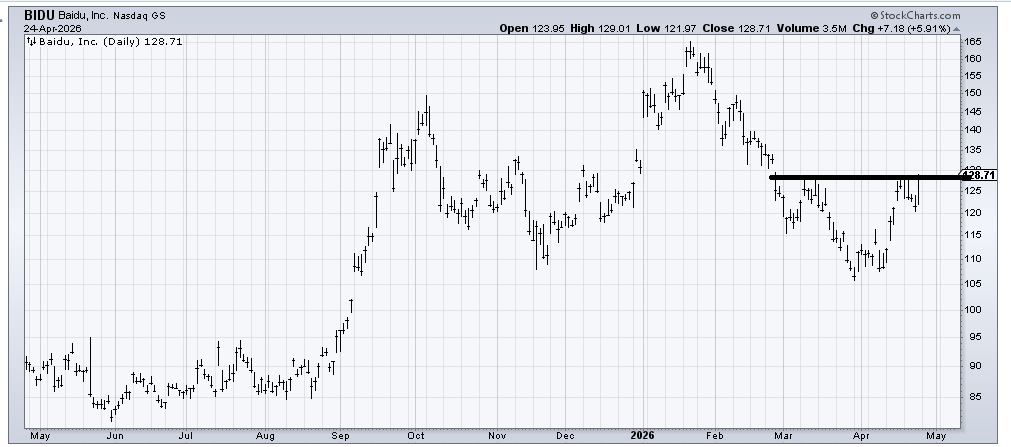
A few weeks ago, I was asked about Baidu (BIDU) , and I was looking for a rally. We got one, then a pullback, and lo and behold, it appears to have formed a possible head and shoulders bottom with a neckline around 129-130.
Today’s Indicator
Above, I note the new lows on Nasdaq had a minor increase last week. So far, it’s not enough to make a huge fuss over, but you can see the increase last week. If they get up in that 200 area, that would be bearish.
Q&A/Reader’s Feedback
Helene welcomes your questions about Top Stocks and her charting strategy and techniques. Please send an email directly to Helene with your questions. However, please remember that TheStreet.com Top Stocks is not intended to provide personalized investment advice. Email Helene here.
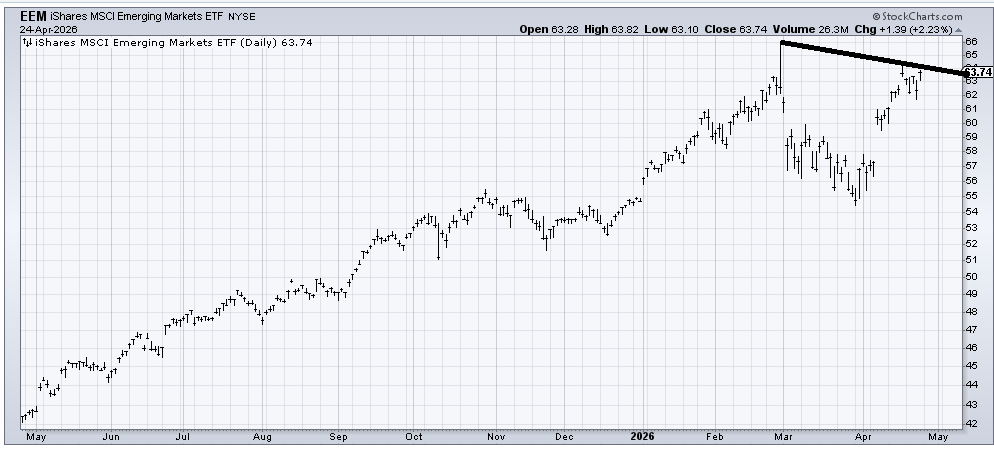
(EEM) , an ETF to be long the Emerging Markets, is lagging after leading for at least the last year. I’ll give it a chance to get over that line, but if it can’t do it soon (the next week or so), this will start to look quite toppy.
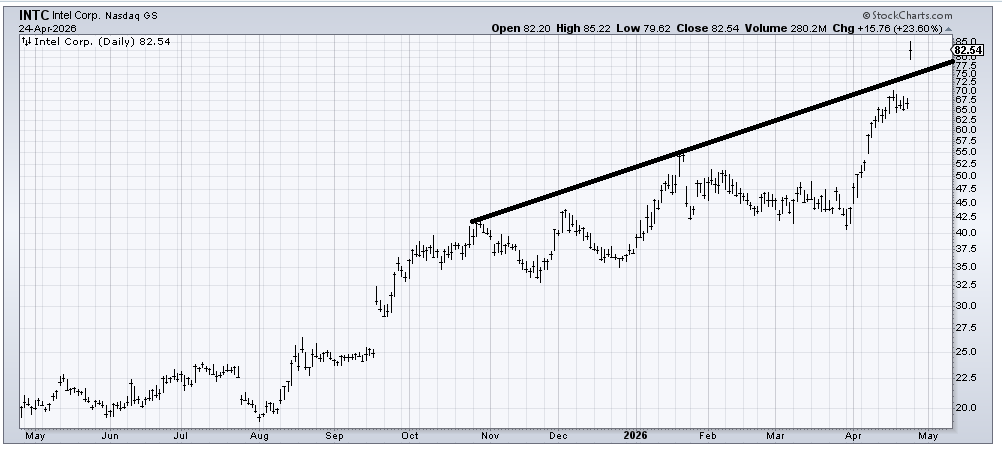
What can we say about Intel (INTC) , which I recommended around 20 (that huge base was right up my alley), and then thought at 40 it had gone far enough? I’ll call it a hold or a chart to take something off. If it gaps down and leaves Friday’s action as an island, then we’d call it bearish; otherwise, there is no pattern to speak of.
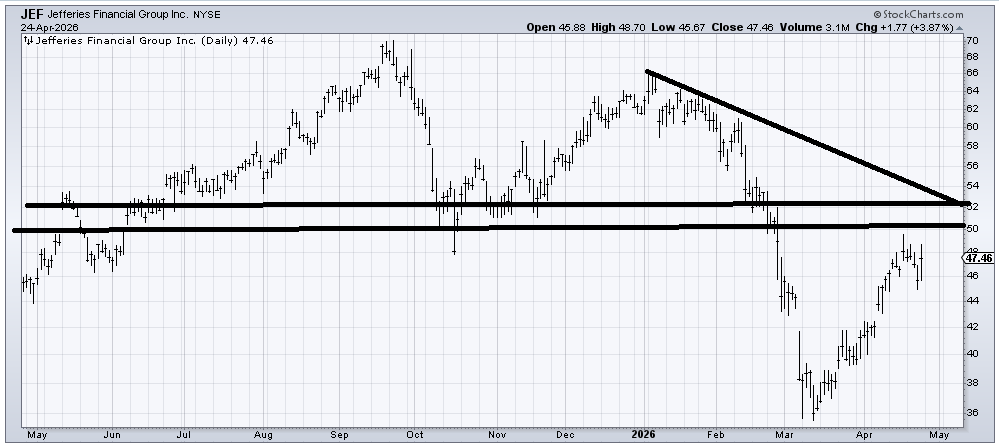
Jeffries (JEF) looks like it’s having a rally into resistance. For the time being, I think that 50-52 area is resistance, and if it turns south before it gets there, that would be bearish.
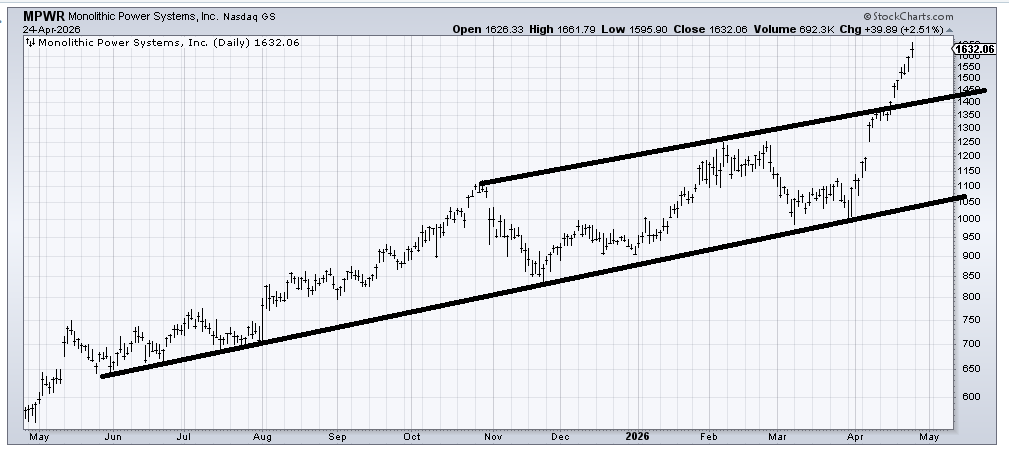
Monolithic Power (MPWR) looks like the chart of the SOX: straight up. There are no more measured targets, and the chart is over-extended. There is not much more to say except that support is back in that 1400 area, which is very far away.
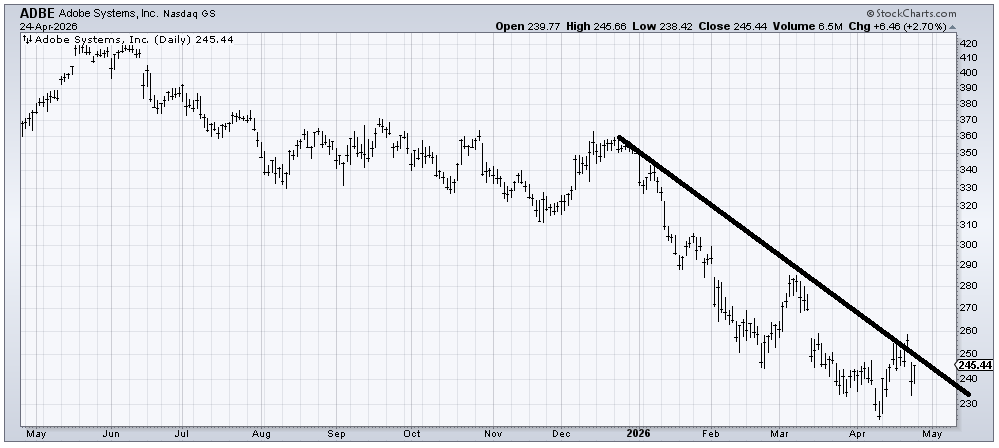
If Adobe (ADBE) can finally cross that downtrend line, then I would give it a chance of filling that gap around 270.
Related: Left for Dead, Intel Roars Back to Drive Market Higher
