My Two Cents on All That Penny Stock Speculation
Let's look at where the market stands as we begin June, including a volume indicator I don't often discuss that's getting 'extreme,' how the options pros agree with me, Boeing, XBI and more.
You've reached your free article limit
You've read 0 of 1 free Pro articles.
The Market
Friday’s action changed very little in the indicators, so let me just remind you where I think we stand.
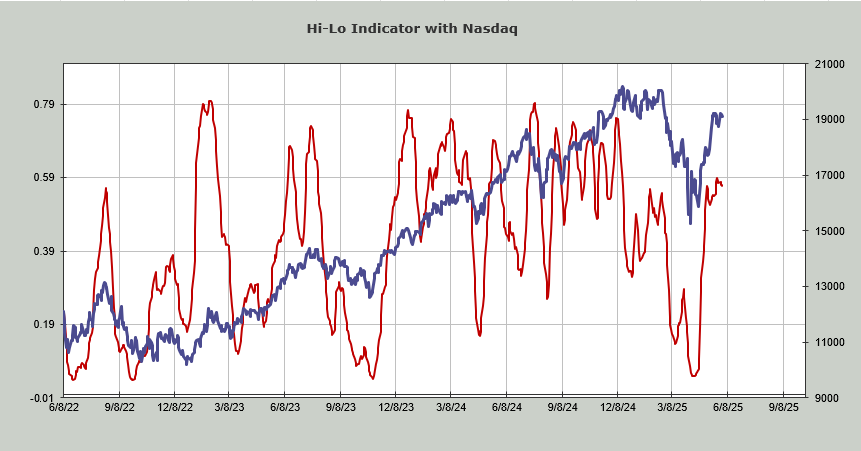
We are intermediate-term overbought, based on almost every measure I have. The 30-day moving average of the advance/decline line is overbought. The Volume Indicator, which sits at 54%, is overbought (mid-to-upper 50s is overbought). The Hi-Lo Indicator is pointing downward. The McClellan Summation Index is pointing downward.
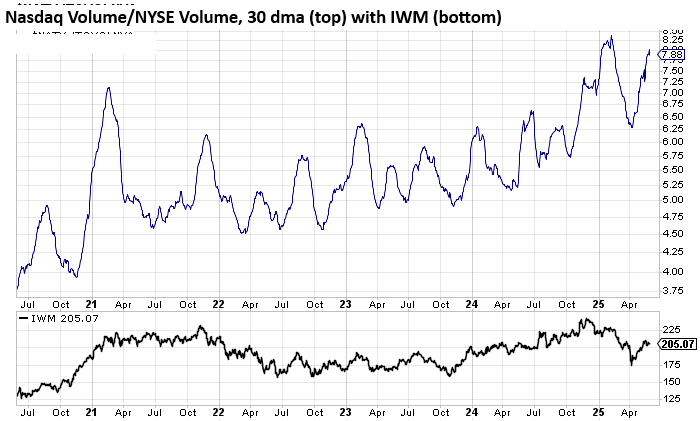
To this I can even add that another volume indicator I don’t discuss often is overbought as well. It is the ratio of Nasdaq volume to NYSE volume on a 30-day moving average. Lately I have written a lot about all that penny stock speculation we’re seeing over on the Nasdaq. Eventually that shows up in the indicators and it finally has. You can see this ratio has stretched almost to the heights it saw in January when it topped 8 to 1 (it is now at 7.88).
It has been making higher highs and higher lows since 2024 so it is possible it makes a higher high now but you can see it is stretching into what I would term extreme speculation.
Note that I pair it up with IWM because the Nasdaq and the S&P 500 are so influenced by the mega-cap names that it’s easier to see what it means for all the other 493 stocks if we use IWM. In 2021, that big peak just over 7 to 1 did not matter for the S&P but the rest of the market was terrible. In fact, 2021 was peak Mag 7 influence in the market.
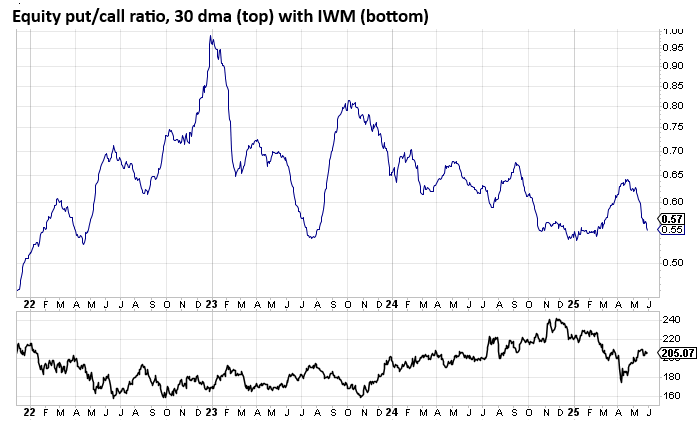
In terms of sentiment, the surveys do not show a high level of complacency (previously noted). The options ratios do. We’ve looked at the 10-day moving average of the equity put/call ratio so today let’s visit the 30-day moving average, which is much slower moving and tends to get less extreme. With the exception of 2021 (not shown on the chart) this mid-50s area has been problematic for the market (meaning too many calls). Once again I have paired it with IWM. It has not turned upward yet though.
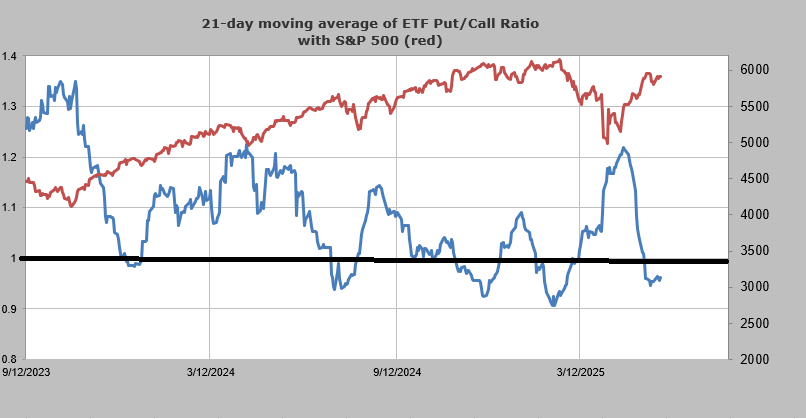
Sticking with the put/call ratios we have the 21-day moving average of the ETF ratio. It has slipped below 1.0, which I would consider low. Here it is paired with the S&P.
Then there is my own Twitter (X) poll, which I have been doing for just over five years now. Each Saturday I ask folks what direction they think the next 100 points for the S&P will go. Since 100 points isn’t what it used to be (!!) perhaps the poll isn’t what it used to be either (when I started it the S&P was near 3500). However, for the last five weeks my respondents have voted "down." That hasn’t happened very often. In fact, it has only happened two other times so our sample set is quite small.
Yet both times their persistence was correct. In the spring of 2023 and in spring of 2022. In the late summer of 2023 they went six out of seven. In each case the S&P fell by at least 5%.
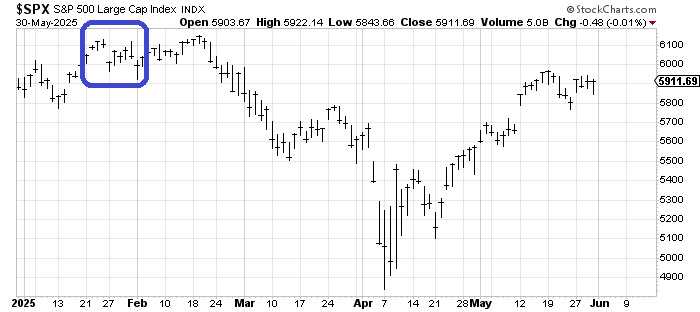
Finally, to get back to the options ratios, last Thursday the put/call ratio for the VIX fell to 0.15. Under 0.20 is my line in the sand for this ratio since it means the VIX call buyers are getting aggressive. This is the one ratio where we want to be on their side; it is not contrary. They were last this aggressive (betting on a higher VIX) in late January (blue box). We did not see an immediate retreat in the S&P. In fact it took nearly a month before the S&P even cared. But I highlight this to you because I have been saying I expect more volatility in the month of June and now the options pros agree with me.
If the other indicators show more than just overbought, like some sign of more aggressive selling, then I would be happy to switch from a volatility call to a bearish one but we just haven’t seen that yet.
New Ideas
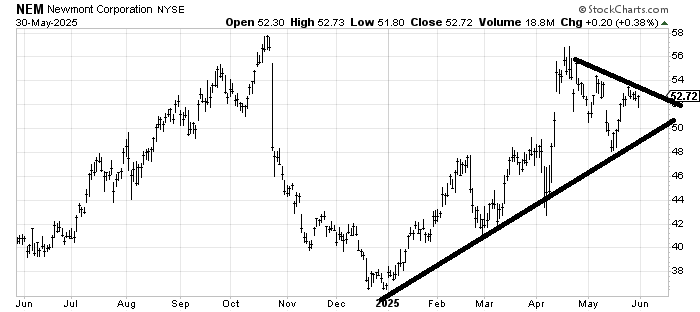
I promised to follow up on Newmont Corp. NEM when it felt as if the correction might be coming to an end. It has begun to feel that way. I’d love to see another down day or two but I’m more focused on if it can cross over $54. I think it can.
Today’s Indicator
The Hi-Lo Indicator is discussed above.
Q&A/Reader’s Feedback
Helene welcomes your questions about Top Stocks and her charting strategy and techniques. Please send an email directly to Helene with your questions. However, please remember that TheStreet.com Top Stocks is not intended to provide personalized investment advice. Email Helene here.
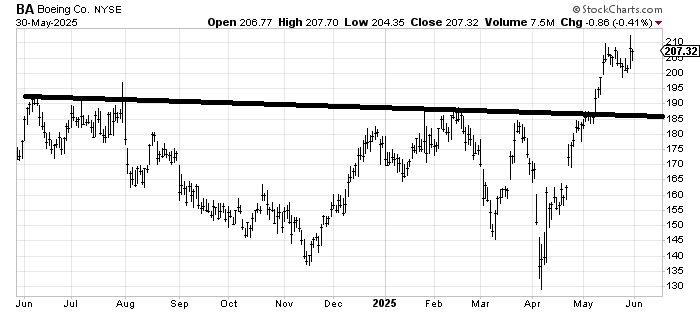
Boeing BA, which I have liked for many months now, has a longer-term target near $250. The question is where is it buyable? From this chart I would have to say all the way back at $185 would be preferable but unless the market weakens significantly it is hard to see it coming all the way back there. So some sideways action for a few weeks (with a floor around $200) would be what I would watch for. A significant break under $200 and that $185 comes into play (and would obviously be accompanied by overall market weakness).
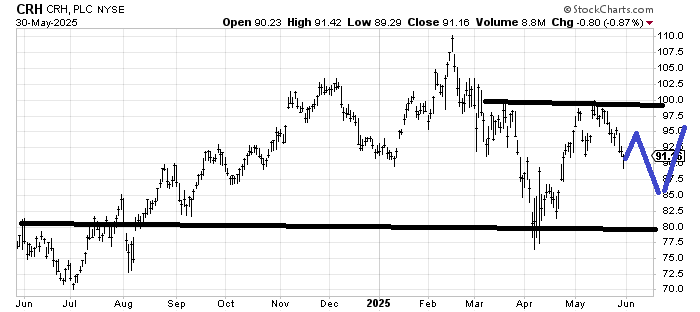
CRH CRH is not a great chart but it is short-term oversold (down 10% in two weeks). If it maps out — a big if — as I have drawn in blue, that would be an interesting pattern because then it will have filled that gap below.
The alternative is to rally to the upper $90s and pull back one more time without filling the gap. Either way it ought to rally this week with that short-term oversoldness.
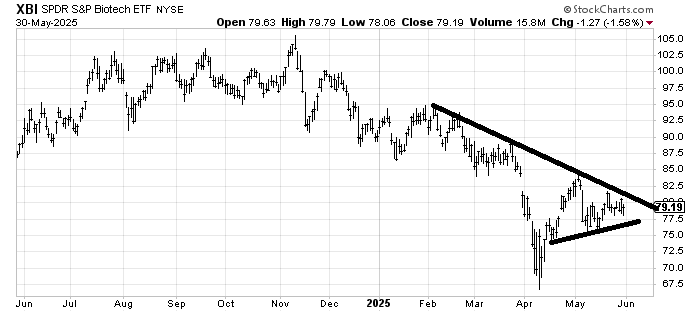
Since I am a fan of Amgen AMGN I was asked about the SPDR S&P Biotech XBI, the ETF to be long biotech stocks. Quite frankly I see very little life in the chart. For now I would say it looks like it is trapped between $75 and $85 so it would have to do something different for me to change my mind.