My Target, Strategy and Awe for Microsoft
Guidance, balance sheet and cash flows were strong and high-margin Azure amazed.
You've reached your free article limit
You've read 0 of 1 free Pro articles.
What stock to write this column about? Not an easy choice. Several huge names reported last night, but the choice really comes down to two. So, I won't be bothering readers with tales of happiness and woe concerning Ford Motor F, Qualcomm QCOM and RobinHood HOOD. The only two names that anyone on Wall Street is talking about are Microsoft MSFT and Meta Platforms META. Both reported (calendar) second quarters that were spectacularly successful. Both stocks are up sharply overnight. I happened to be wearing a long position in Microsoft and have long been an investor in the name. I have a spotty past trying to trade META.
Therefore, I will hit you with the stock that I have done well with and leave Meta for one of my colleagues to address. Microsoft released on Wednesday evening fiscal fourth-quarter financial results. Microsoft posted a unadjusted earnings per share of $3.65 on revenue of $76.441 billion. The bottom-line print beat the Wall Street's expectations by an impressive $0.27 per share. If that's not enough, the top-line number absolutely laid waste to consensus view, beating Wall Street by more than $2.5 billion, while sporting year over year growth of 18.1%.
What I think Microsoft was able to do was re-establish investor faith that this is still a leader -- and may be the leader -- in the development of generative artificial intelligence. Perhaps the single most exciting bit of information released in the report was that its Azure cloud computing/AI platform had generated more than $75 billion in sales for the entire fiscal year, which was good for a 34% boost over the fiscal year prior.
Operations
As mentioned above, revenue generation increased 18.1% to $76.441 billion. Within those sales, product sales grew 29.7% to $17.136 billion, as sales of services increased 15.1% to $59.305 billion. The cost of those sales grew 22% to $24.014 billion, leaving a gross profit of $52.427 billion (+16.4) as gross margin dropped from 69.6% to 68.6%. That, however, was enough to beat expectations.
Operating expenses increased 5.8% to $18.104 billion. This left operating income at $34.323 billion (+22.9%) as the operating margin improved from 43.1% to 44.9%. This too, beat expectations. After accounting for interest, other income & expenses and taxes, net income printed at $27.233 billion (+23.6%). That works out to $3.65 per fully diluted share vs. $2.95 for the year-ago comparison.
Segment Performance
- Productivity & Business Processes... generated revenue of $33.112 billion (+15.7%), which produced an operating income of $18.993 billion (+20.9%). This is the segment that includes Microsoft 365, the firm's family of Copilot applications, LinkedIn and Dynamics 365.
- Intelligent Cloud... generated revenue of $29.878 billion (+25.6%), which produced an operating income of $12.14 billion (+23.4%). Here is where we find the Azure platform, which grew sales a stunning 39% for the quarter versus estimates with a 34 handle. This is one major reason why the stock is trading higher.
- More Personal Computing... generated revenue of $13.451 billion (+9.2%), which produced an operating income of $3.19 billion (+33.8%). This segment is the home of Windows, Xbox, the Bing search engine and news advertising services.
Guidance
For the current quarter, the firm's fiscal first quarter of 2026, Microsoft projected ranges for expected sales for its segments. The company lets us analyst-types then put the pieces together and add everything up. This is the way that Microsoft has always issued forward looking guidance.
For the quarter, at the midpoints of these ranges, MSFT is projecting revenues of $33,35 billion from the Productivity & Business Processes segment, $30.25 billion from the Intelligent Cloud segment, and $12.65 billion from the More Personal Computing segment.
This guidance beat Wall Street's expectations for both the P&BP and IC segments but not the MPC segment. When totaled, MSFT is projecting quarterly sales of $75.25 billion, which is more than $1 billion above where Wall Street was on this number and would be good for year over year growth of close to 15%.
Fundamentals
For the period reported, Microsoft generated operating cash flow of $42.647 billion (+14.7%). Out of that number came capital spending of $17.079 billion (+27.4%). That left free cash flow of $25.568 billion (+9.6%), which beat expectations by more than $5 billion. That's incredible. Out of that number, Microsoft repurchased $4.546 billion in common stock for its corporate treasury while dishing out $6.169 billion in cash dividends to shareholders.
Turning to the balance sheet, Microsoft ended the quarter with a cash position of $94.565 billion and inventories of just $938 million. That put current assets at $191.131 billion. Current liabilities add up to $141.218 billion including $2.999 billilon in shorter-term debt. This also includes $64.555 billion in unearned revenue, which is not a true financial obligation unless goods and services already owed go undelivered. That puts the headline current ratio at a healthy enough 1.35. Once adjusted for those unearned revenues, this ratio becomes a very muscular 2.49.
Total assets amount to $619.003 billion, which includes $142.113 billion in goodwill and other intangibles. At roughly 23% of total assets, this is not quite large enough to cause concern. Total liabilities less equity comes to "just" $275.524 billion including $40.152 billion in long-term debt. This is something MSFT could pay off out of pocket more than two times over. This balance sheet is in very good shape.
My Thoughts
What's not to like? The quarter was excellent. Guidance was strong. Cash flows were strong. The balance sheet is strong. The high-margin Azure cloud computing / AI platform is not just strong but accelerating despite competition from the likes of Amazon's AMZN AWS, Alphabet's GOOGL Google Cloud and to a lesser degree, Oracle ORCL and IBM IBM. I see no negatives except for the increase in capital spending, but that's driving the gains made throughout the firm. A necessary cost of doing business.
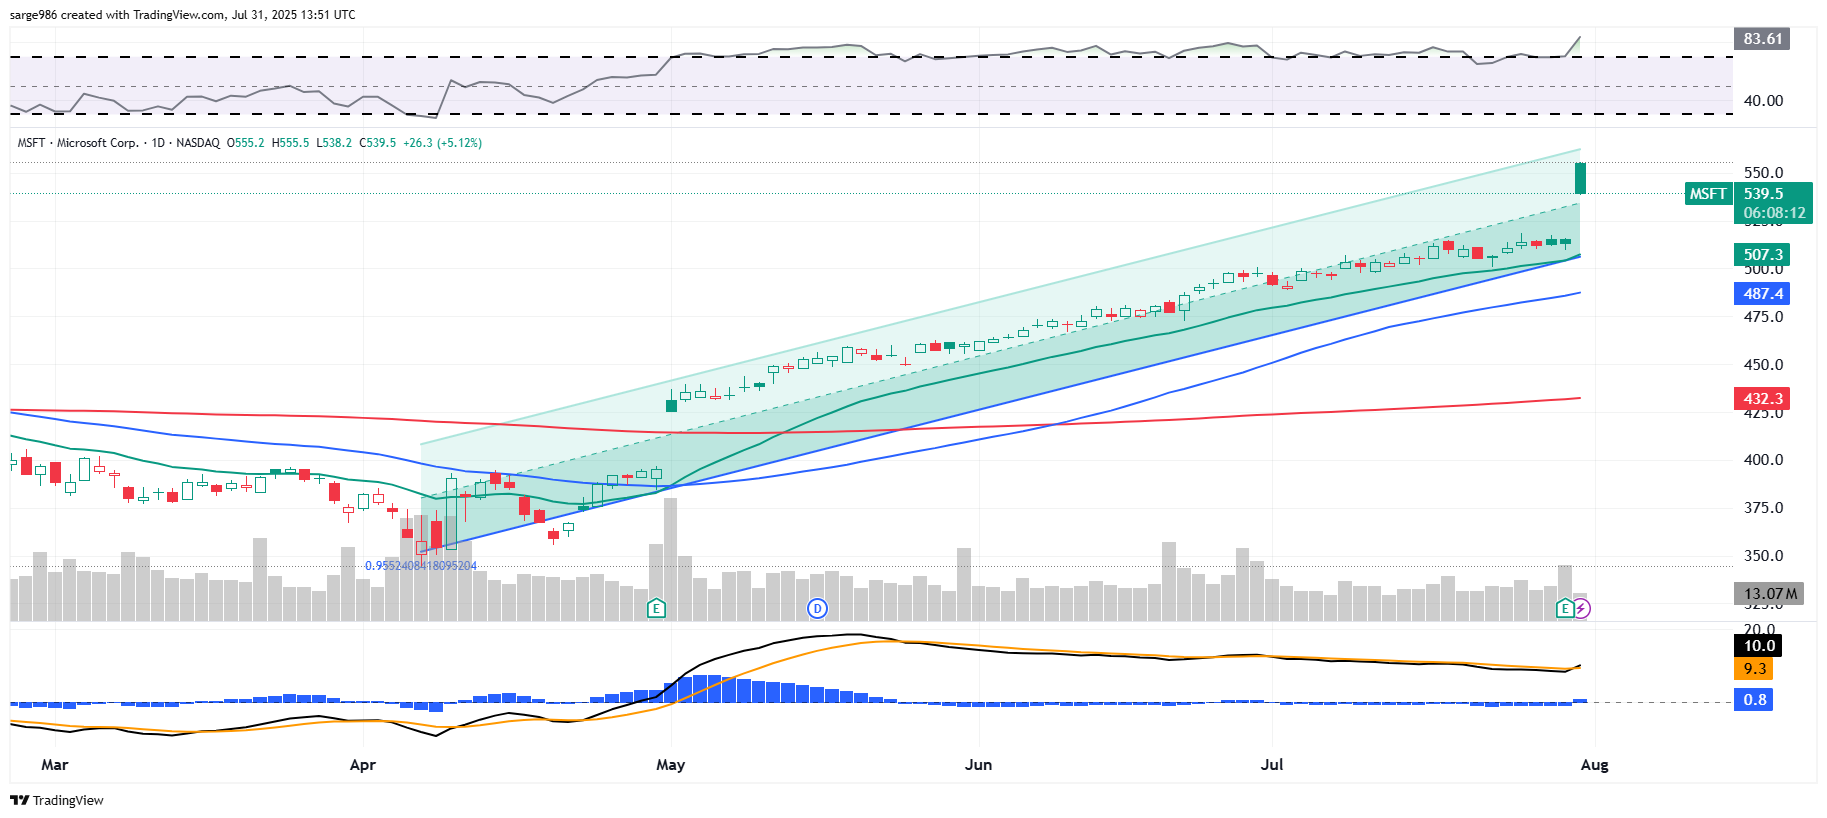
This is a very simple chart. No tough-to-define patterns of any kind of reversal. Just a trend that remains in place. That trend, which began in earnest at the lows in early April, is illustrated here by a Raff Regression model. Readers will see that the stock did hit some resistance this morning as it approached the upper trendline of the model and has pulled back toward the central trendline. This is after the stock tested its 21-day exponential moving average from above just last week. The upper trendline becomes the pivot.
Relative Strength has gone from being strong to being technically overbought, which may be one reason why algorithmic resistance did show up. The daily Moving Average Convergence Divergence has just flipped from a bearish looking posture to something looking far more bullish. The histogram of the 9-day exponential moving average has moved into positive territory as having been negative since late June. Additionally, the 12-day exponential moving average has crossed above the 26-day exponential moving average, also for the first time since late June. Bullish is the only way I see this.
Microsoft Strategy
Target Price: $675
Pivot: Upper Trendline of model (currently $562)
Add: from 21-day SMA down to 50-day SMA.
Panic: Upon failure of said 50-day SMA.
At the time of publication, Guilfoyle was long F, MSFT equity.
