Mute the China Trade Talks News and Focus on the Statistics
On the eve of China trade talks, you can either get caught up in the rollercoaster of statements or focus on what the market is doing.
You've reached your free article limit
You've read 0 of 1 free Pro articles.
The Market
Everyone seems quite excited about the trade talks with China that will take place in Europe on Monday. But I would like you to think back a month ago when Treasury Secretary Bessent was set to meet his Chinese counterpart, also in Europe. It was a Saturday.
Folks were not so excited that weekend. They were nervous, concerned. I recall it quite well because each Saturday, I conduct a poll on Twitter, asking what folks think the next 100 points for the S&P will be. The poll starts at 7 am EST and ends at 1 pm.
The early birds voted as soon as the poll went up, with the bias being UP. Then a headline came across that the Chinese had left the meeting, and the chatter was how bearish that was, and I could watch, in real time, how my poll flipped from UP votes to DOWN votes.
It turned out the Chinese delegation had only stepped out for lunch, and by Sunday evening, there was all sorts of good news, and the market gapped up on Monday morning.
While the circumstances are not the same this time, in that the meeting is not on the weekend, so we don’t have headlines, I ask you, is there anyone who thinks there will not be some level of positive news that comes out of this meeting? And even if there is not, the hope and confidence that there will eventually be a deal is now the default. Because that’s the way trade talks go. Anyone who has been around long enough knows that old phraseology: We had productive talks, and things are progressing.
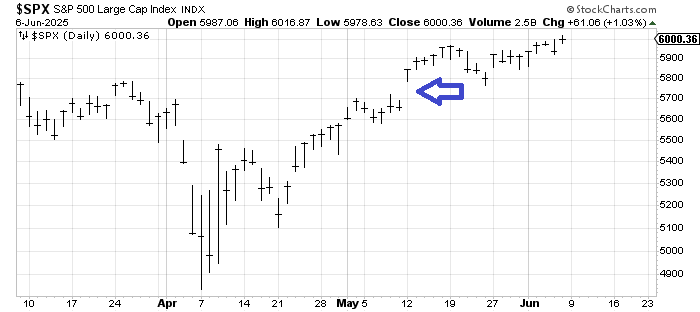
And so, as usual, I say we should mute the news and focus on the statistics. Friday’s rally felt in many ways like many of the rallies of the past few weeks, run the shorts in, and that’s that. Breadth was good. It was even enough to halt the decline in the McClellan Summation Index. But the same way I thought breadth needing +400 advancers minus decliners on the NYSE to halt the decline was easily reversible, I view the now -400 as easily reversible. So, I’ll call it a step toward a more positive breadth bias.
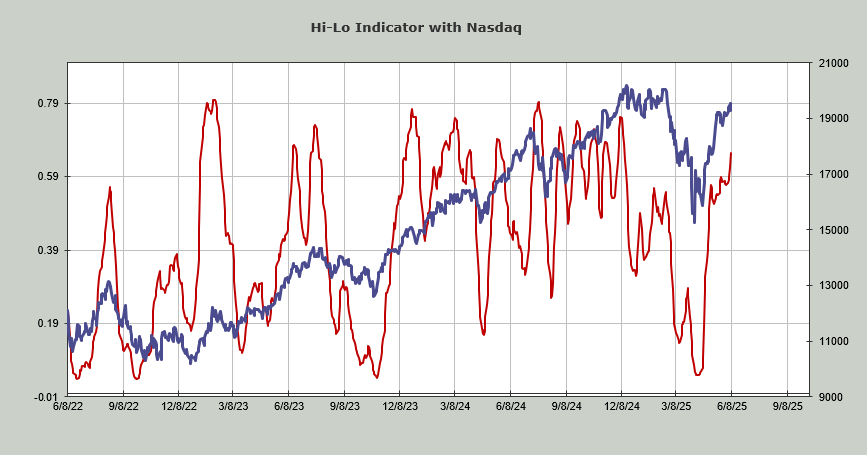
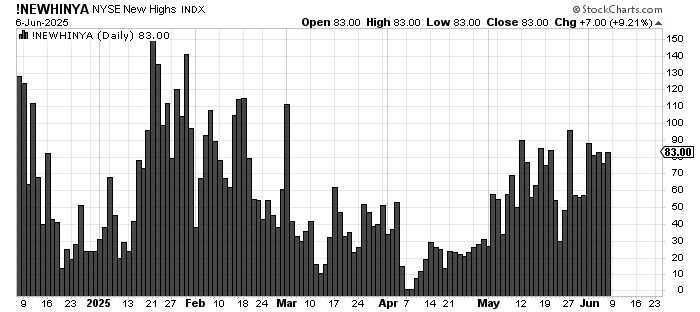
Yet the number of stocks making new highs refuses to expand. The good news is the Hi-Lo Indicator is heading upward, but it’s not because new highs are expanding but rather that new lows are still contracting. Typically, when the Russell 2000 moves up to a higher level, as it did Friday, we see an expansion in new highs, and we did not. I’ll keep an eye on that this week. The chart is shown below.
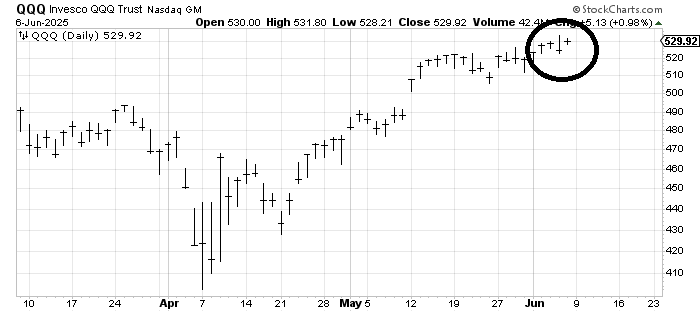
The other charts we’ll watch this week are the QQQs and the SOX. On Friday, neither traded over Thursday’s high.
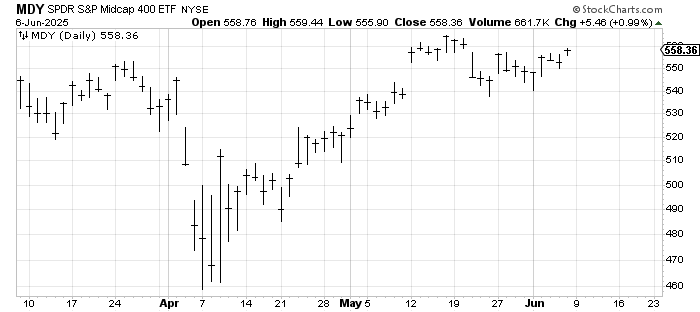
To that, I will add the chart of the Mid-Caps. Typically, the Mid-Caps MDY and small caps (IWM) travel together. Only, now we have IWM over the May high and MDY still under it.
Yes, we’ll also watch the bonds since they are headed back down again. I still think that 84-ish area holds on TLT, but the market will tell me if I am wrong on that.
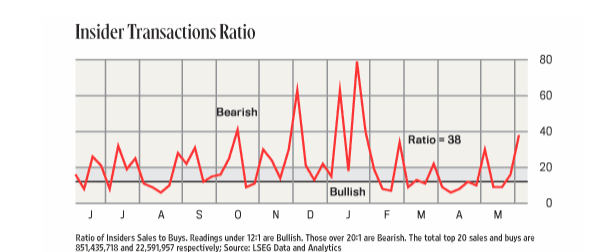
Finally, the only other change is that the Insider selling has picked up with the ratio now at its highest level since January (but not that high).
New Ideas
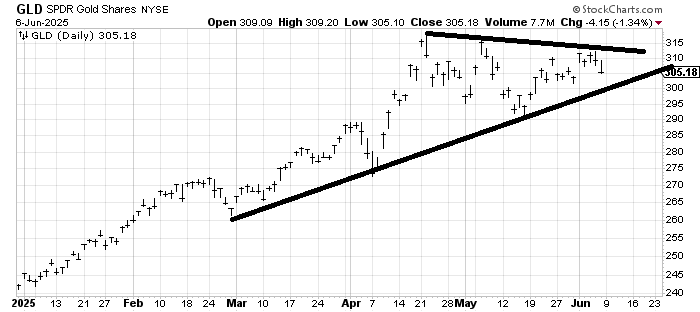
I want to revisit the chart of GLD since I said last week I thought it would break out, and Friday’s action told me I was wrong in that assessment. A break of 300 (round number/uptrend line) would confirm that I was wrong to think it would break out.
I was asked if I still lean positive on drug stocks, and the answer is yes. Amgen got to resistance and needs a pullback. Merck needs to get going, as does Bristol Myers.
Today’s Indicator
The new highs and new lows are discussed above.
Q&A/Reader’s Feedback
Helene welcomes your questions about Top Stocks and her charting strategy and techniques. Please send an email directly to Helene with your questions. However, please remember that TheStreet.com Top Stocks is not intended to provide personalized investment advice. Email Helene here.
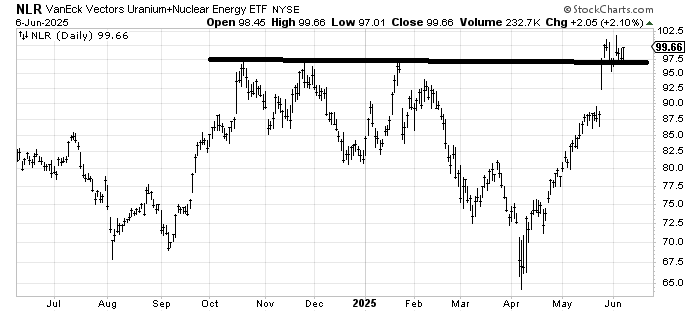
NLR, an ETF to be long Uranium and Nuclear Energy, is not my kind of chart because it is up at the top, but as long as it doesn’t break back under 95, it should be okay. I do wonder if energy rallies, does it do so at the expense of these ‘new energy’ stocks?
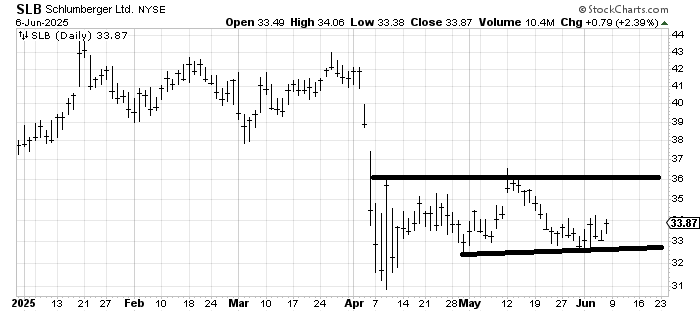
Since I noted OIH has been outperforming XLE last week (a positive for energy), I was asked if I still liked Schlumberger SLB. I do. I will always be drawn to stocks that are bouncing along the bottom. Under 32.50-ish and I’ll be wrong.
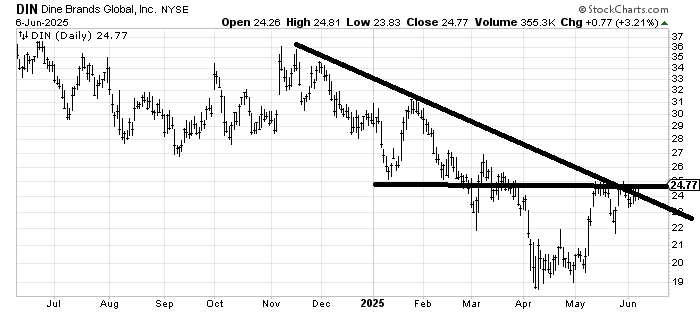
Dine Brands DIN is an interesting chart because it has so much resistance, even if it can cross over this resistance at 25, but also because it has such a big yield. Lately, the high-paying dividend stocks have languished, so over 25 would be quite a change in sentiment for this group.