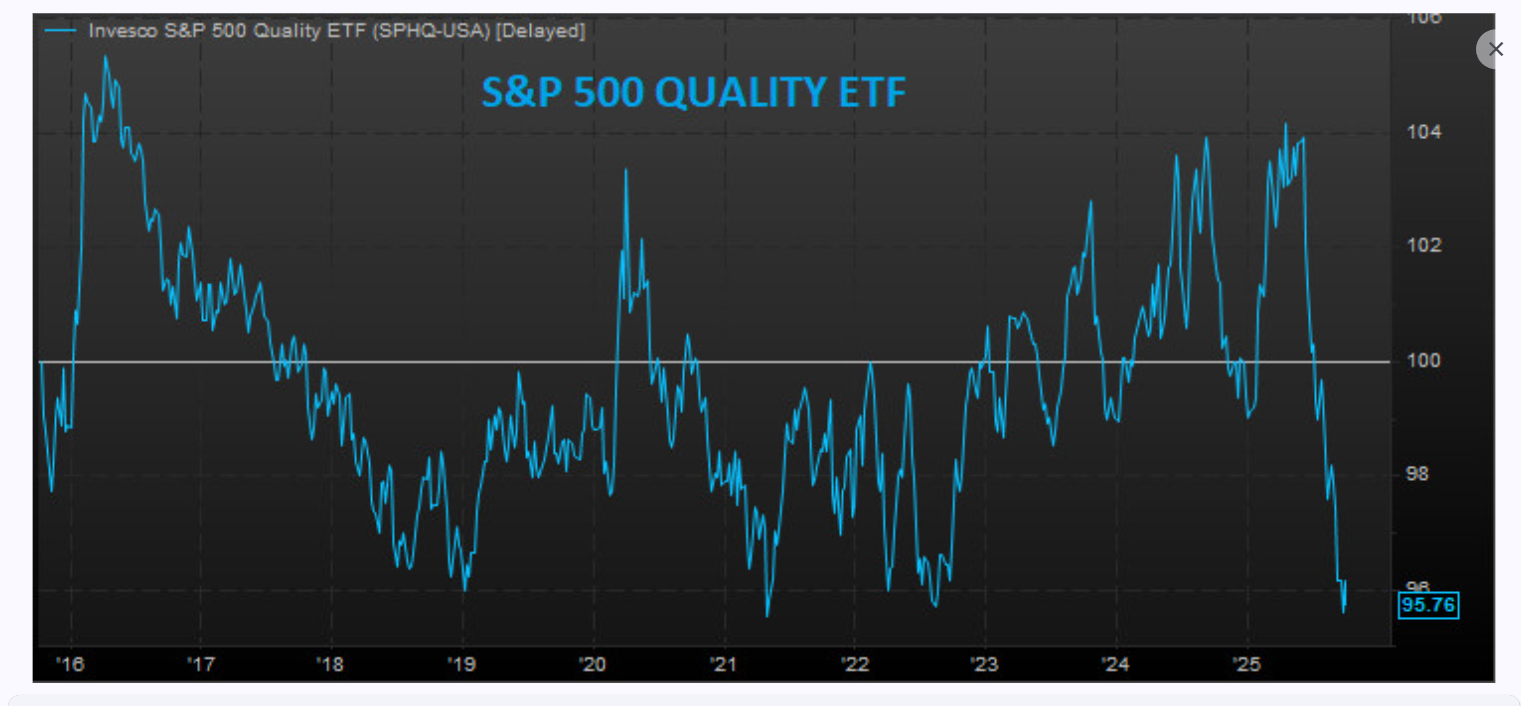
Much of the Recent Rally Is Low Quality — Indicating Serious Risk-Taking
That plunge in the S&P Quality ETF in the past month or so tells you how far away from the quality stocks folks have gone.
You've reached your free article limit
You've read 0 of 1 free Pro articles.
The Market
Note that today’s market missive is quite lengthy and does not delve into today’s statistics (they weren’t great) but rather takes the time to give an overall view of where I think the market is.
We’ve lately seen a lot of so-called signs that the rally is long in the tooth. There are the stats that the S&P has gone more than 30 trading days without a 1% correction, but that’s not what I’m thinking about. I’m thinking about where sentiment is and where the indicators are.
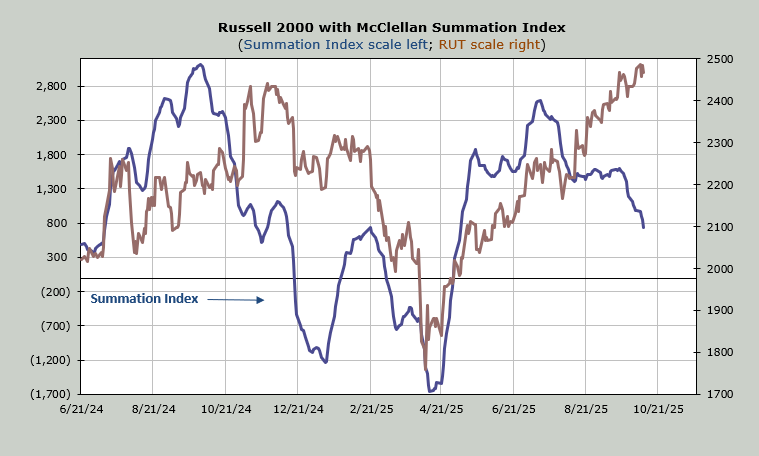
The indicators, as I have said, have mostly not participated in the rally since August. The McClellan Summation Index, which I believe represents the majority of stocks, went sideways for six weeks and then instead of firming up it went down and is still heading down.
The number of stocks making new highs has not increased, which tells us the market is getting narrower, not broadening out as everyone seems to think. I believe the view is that if money is not flocking into the Mag 7 on a daily basis (it is not), then we must be broadening out.
About 3,000 stocks trade on the NYSE. In the past 10 trading days we have had only two quadruple-digit readings, which is unusual for a market that has seen the S&P relentlessly rise. One of those readings was Thursday. And of those 10 trading days, breadth has been up five days and down five days.
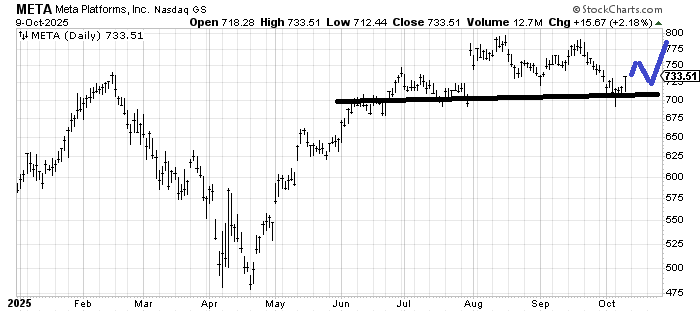
We have seen the majority of the market leaders falter. I’ve gone on about Amazon and Meta, but when the S&P made a new high a few days ago, not one of the 10 largest (by market cap) stocks made a new high. And now the banks/financials are struggling.
Most of what we’ve seen in the recent rally is low quality. Here is a chart of the S&P Quality ETF relative to the S&P. That plunge in the past month or so tells you how far away from the quality stocks folks have gone — so much farther out on the risk curve.
If that wasn’t enough Liz Ann Sonders of Schwab provided us statistics from Bloomberg the other day on small caps. Using the Russell 2000, 57% of the index is currently profitable while 41% is unprofitable.
Since the April low the profitable part is up 22%. The unprofitable is up 53%. That is the "quality" issue the market has at present.
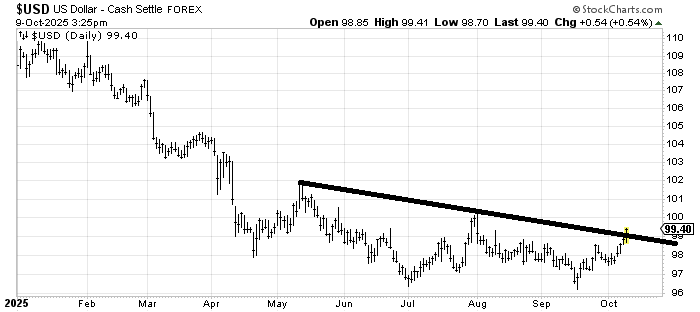
Then there is the rally in precious metals or just metals. It has gotten way out of hand in my view. I have harped on it enough in the past few days, but suffice to say they are in need of pullbacks, especially since the US Dollar Index is peeking over that line I drew the other day.
On the sentiment front we had some extreme ISE call/put readings on Wednesday this week, as high as the final week of December. We’ve seen the Investors Intelligence bull/bear ratio move up to 3.75. It was 3.91 in December. Extreme is in that 4.0 area.
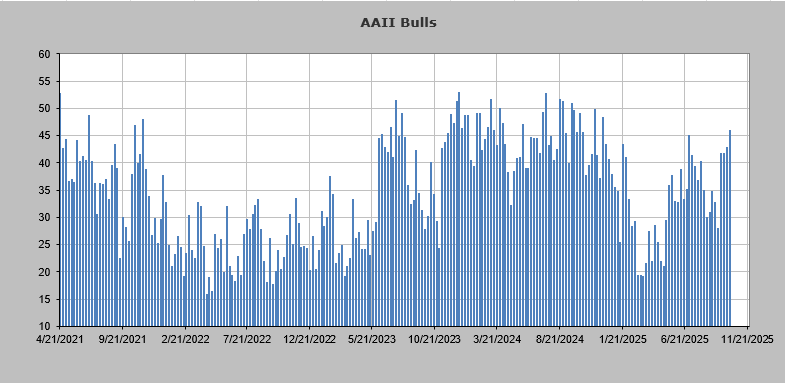
On Thursday we saw the AAII folks join the bull parade. Oh, don’t worry, they have not thrown caution to the wind. But the bulls are higher than they were in early July, which is the highest since just after the election.
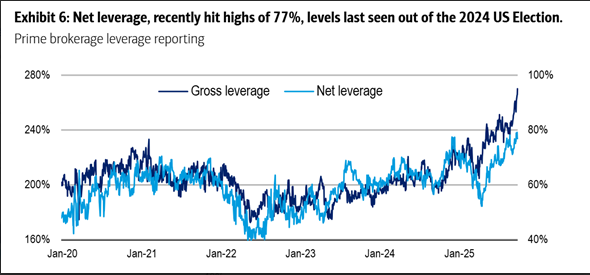
We know the Citi Panic/Euphoria Model is in Euphoria. We know the insiders have been selling. In terms of exposure the NAAIM folks are not overexposed, as they stand at 84. But when to comes to hedge funds, let’s not use gross leverage since that looks very extreme. Let’s use net leverage and we can see that is now where it was right after the election, according to Bank of America. In other words, these folks are mostly all in.
We have seen plenty of stocks take it on the chin lately: the restaurants, some asset managers and now the homebuilders. I have called it group rotation because as you might have noticed Thursday, they finally rotated back into names like Meta (META) and Amazon. (AMZN) The market as a whole ought to correct, but until we see that occur, this rotation, which is getting narrower and more speculative, is worth paying close attention to.
New Ideas
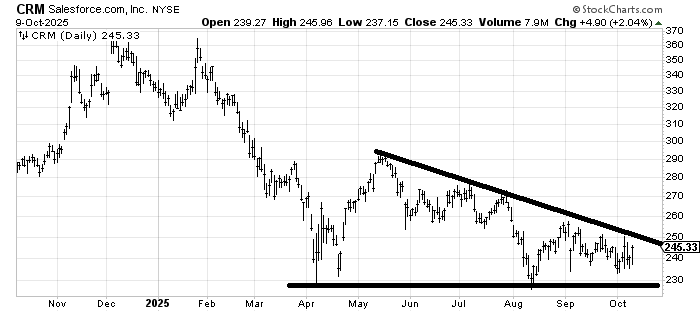
Salesforce.com (CRM) has been so bad for so long that I don’t know whether it can lift itself, but it has begun to feel a little bottoming-like. Back under 230 and I won’t much like it, but over that line around 250 I think chart folks might glom onto it.
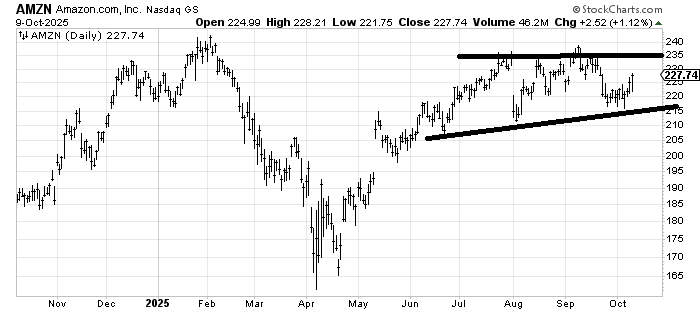
I was asked where I think Amazon (AMZN) is going and I’ll start with that 235 area as a next target. I might want to lift that, but for now that’s where I see it. Mostly I just don’t want to see it back under 220.
As for Meta (META) , which finally had a good day: My initial thought is it ought to get into the 750 area, but if it rallies, pulls back and then rallies again the setup would be much better.
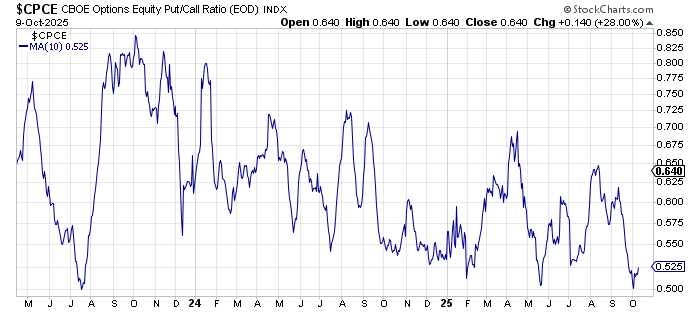
Today’s Indicator
The 10-day moving average of the equity put/call ratio has gotten very low. We have had a correction each time it has gotten down here.
Q&A/Reader’s Feedback
Helene welcomes your questions about Top Stocks and her charting strategy and techniques. Please send an email directly to Helene with your questions. However, please remember that TheStreet.com Top Stocks is not intended to provide personalized investment advice. Email Helene here.
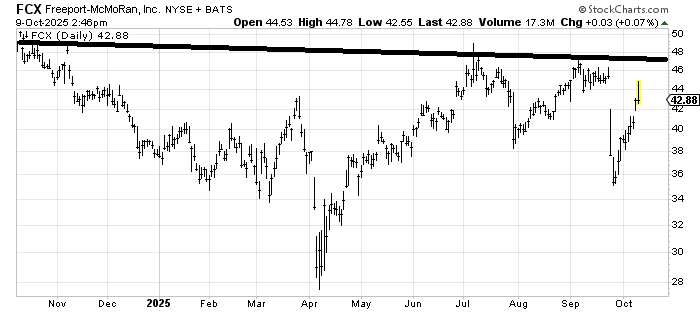
We looked at Freeport McMoRan (FCX) a week or so ago and I thought it ought to fill that gap. it did today; now it needs to set up a new pattern for me to get further involved. That means either coming back down into the 38-40 area (to form a W) or going sideways to digest the push up from 36. There is just too much resistance overhead, and the metals need some cooling off. Here's hoping we get a new setup in the next few weeks.
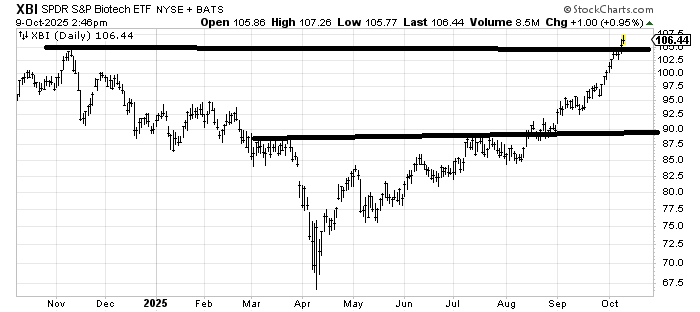
I have been positive on (XBI) , an ETF to be long the biotechs, for quite some time, believing that they would simply and slowly chew their way through resistance. In the past few weeks, though, that pattern has changed and they have gone not quite parabolic but have surged. That is usually a sign they are getting overdone up here and are in need of a pullback. I’d love to see XBI just go sideways in this 104-106 area.
There is a next measured target around 110, so basically I think if you wanted to sell some here, it’s not a bad idea. Otherwise hold with an eye to a better setup.
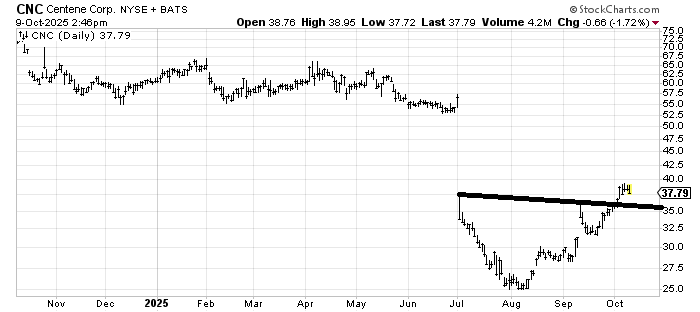
I don’t love the chart of Centene (CNC) , but if it pulls back to 35 and can hold that level, it would give me more confidence that it can eventually fill that gap. The problem is the gap is quite large, so I sense much patience will be needed. For starters, let’s see whether it can hold 35 on the pullback.
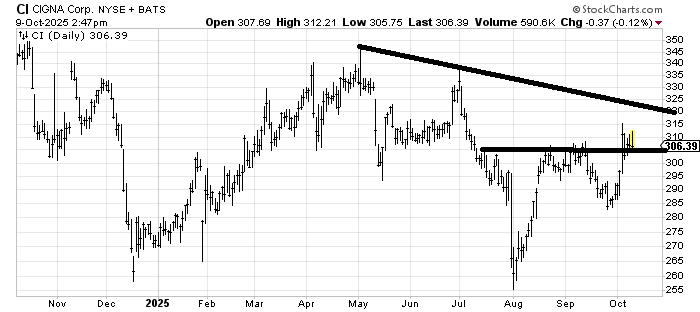
We’ve had some good trades in Cigna (CI) in the past year, but as you can see, the stock is mostly sideways in that period, just with swings (to trade). I am tempted to think that if this 300 area holds for the next few weeks, it would then have another move up toward that downtrend line (320ish). Otherwise, this is precisely the type of chart I have in my head when I say: It’s constant group rotation without going anywhere special.
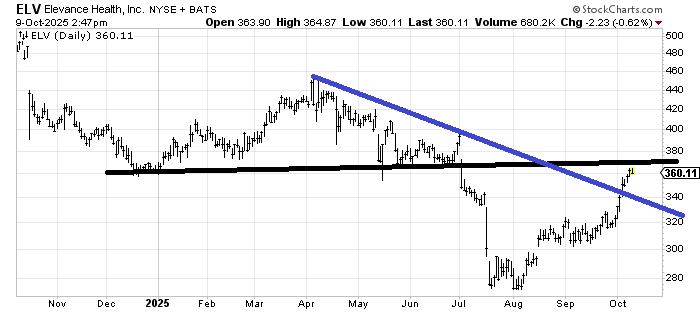
Elevance Health ELV is nearing resistance as well as a measured target. And it’s had quite a run in the month of October. I would guess we see a pullback in the coming weeks, down toward that blue line.