Microsoft Is Quietly Holding Up While Software Gets Crushed
While many software names broke down on heavy volume, MSFT stayed unusually steady—an important divergence as the group enters a tougher phase.
You've reached your free article limit
You've read 0 of 1 free Pro articles.
 Wall Street Lead (RD 101425)
The Market
Well, if you thought the upside volume on Wednesday wasn’t great, then you definitely won’t like today’s because it chimed in at 50%. That’s right, volume was not great on the upside. In fact, overall volume wasn’t great either.
However, none of the indicators have changed. The Oscillator is still not yet overbought, although with seven straight up days, we are more likely to get a down day before we get overbought now. My own Oscillator has stalled out, but as long as the market doesn’t collapse in the next few days, the Oscillator ought to get overbought next week. I have earmarked Tuesday, although we know the exact day is not what matters, but the general time frame.
To add to this, I decided to check in on the Nasdaq Momentum Indicator. You may recall I had done some what-ifs on it a few weeks ago, and it got oversold right around the lows. Now, what I have done is I have walked it up about 1000 points over the next week or so, and you can see it gets overbought on the 14th (Tuesday). Again, the exact day is not what matters but the general time frame.
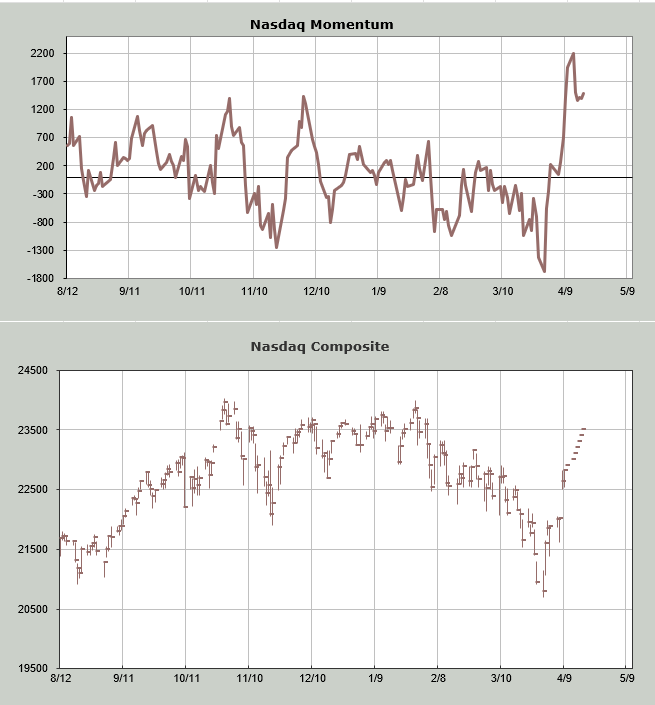
Just based on these two indicators, I would say if we back off on Friday, we’ll probably rally again early next week. After that, we ought to lose some of the upside momentum.
Yet most of the indicators are still pointing upward, so for now it ought to look like a rest period, even if we see a pullback.
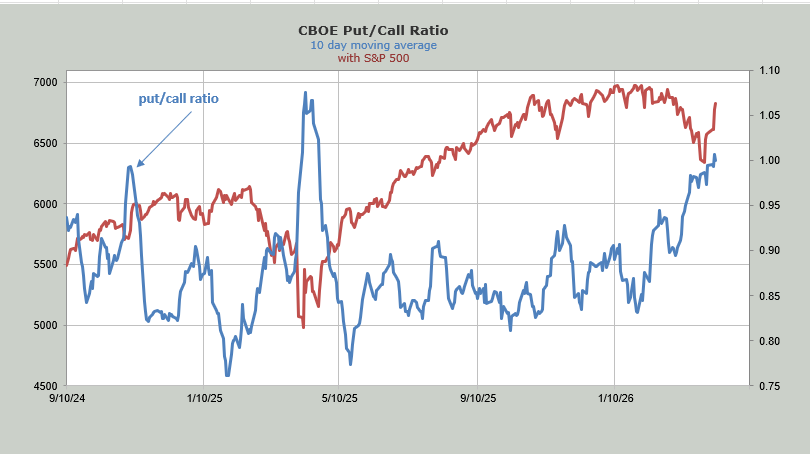
In terms of sentiment, I can see some anecdotal change, but mostly folks are not rushing to embrace the rally. Down below, you will see that the ten-day moving average of the put/all ratio is still high. I expect it to come down next week.
New Ideas
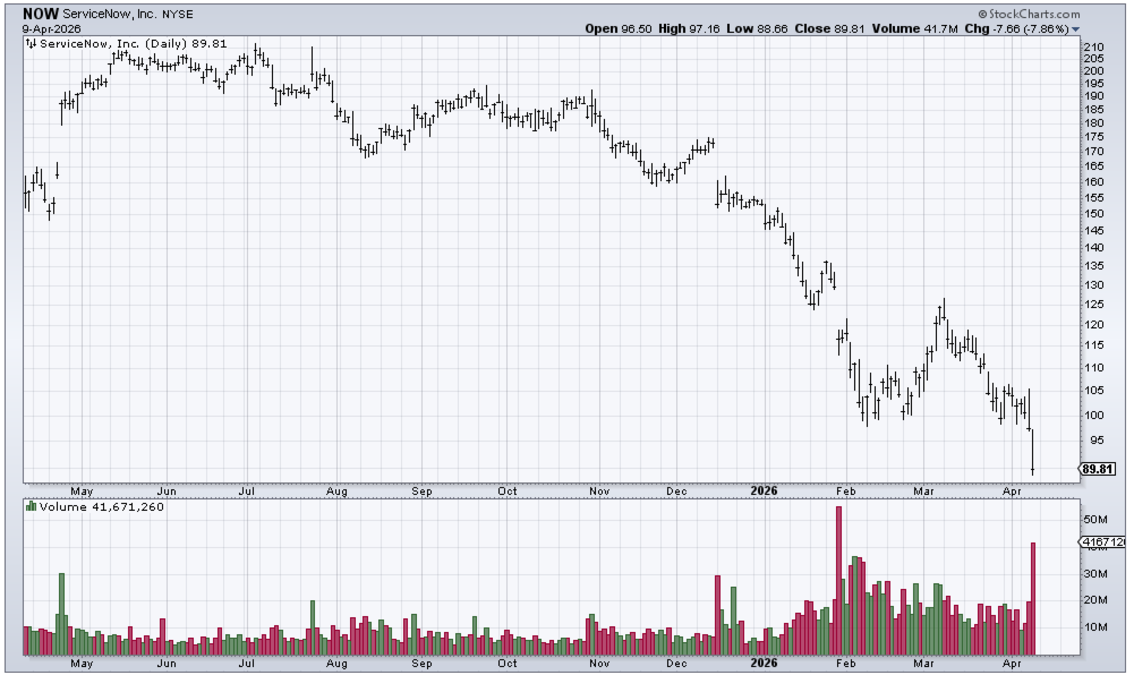
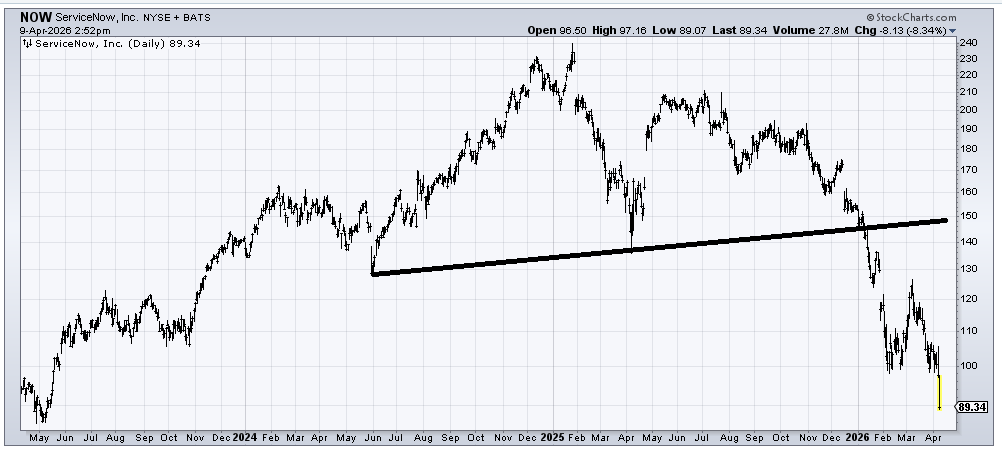
I feel I need to address software. Yesterday I noted that it got sold, and today most/many got clobbered, with many making new lows. They did so on some pretty high volume. Down below, you will see comments on NOW, but here I want you to see the volume: quite a surge. It is a little bit panicky.
As you know, I have been advocating for Microsoft (MSFT) in the group. It has done very little since I recommended it, and today it closed flat on the day, which I figured was a victory given the move in most of the group. So I looked at MSFT relative to software, and gosh, it’s almost impressive how well it has done. I don’t think there is much that we can say about the others just based on MSFT’s action, but I thought it was interesting how it has fared relative to the group.
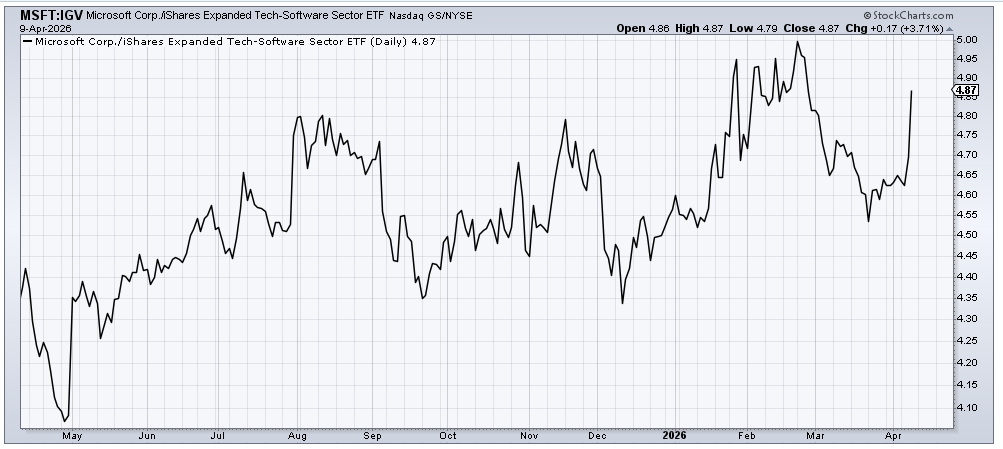
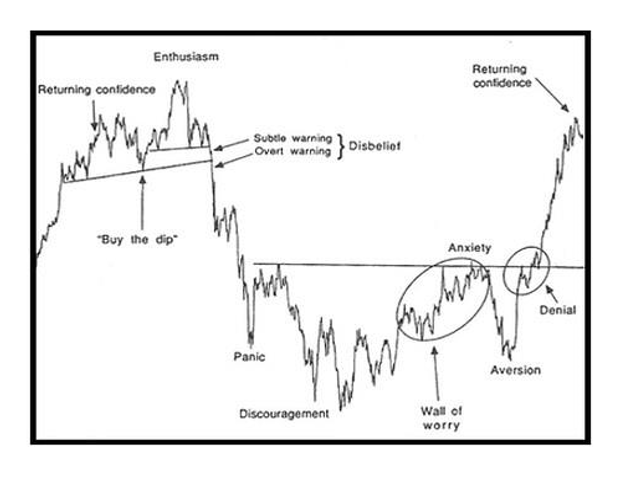
Finally, let’s go back to that Sentiment Cycle chart. Just before the rally began, I said I thought software (IGV) was heading into Discouragement and I still think that is where we are heading. Based on the volume in the stocks today, I would not be surprised to see them rally in the next few days, especially if we get a lower low in IGV first.
Keep this chart in mind because, as I have noted several times in the last few months, we should see the stocks differentiate themselves, and then there is a long base-building process ahead.
Today’s Indicator
The ten-day moving average of the put/call ratio is discussed above.
Q&A/Reader’s Feedback
Helene welcomes your questions about Top Stocks and her charting strategy and techniques. Please send an email directly to Helene with your questions. However, please remember that TheStreet.com Top Stocks is not intended to provide personalized investment advice. Email Helene here.
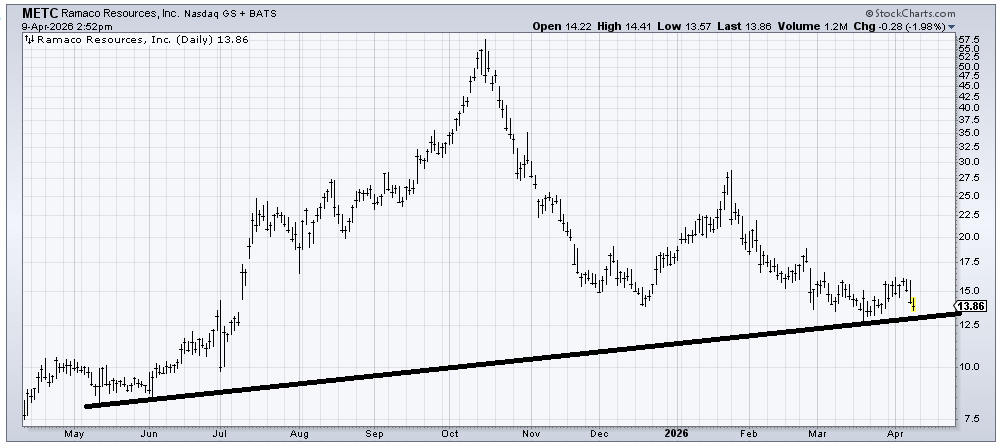
Ramaco Resources (METC) is not even a software stock! Seriously, the risk/reward is okay here because under 12.50 and you are wrong. But if this is a bottom, you are probably only halfway through it, so patience will be needed. I don’t love the chart, but as long as it stays over 12.50, it gets a chance to prove me wrong.
Service Now (NOW) is coming into some light support in the 85 area. I have a next measured target around 80, so I would look for the stock to get short-term oversold in that area.
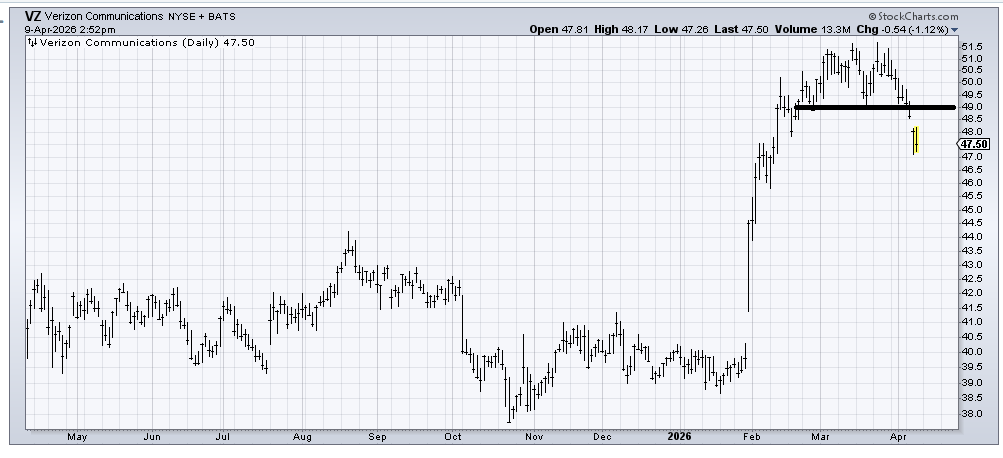
Verizon (VZ) broke down on a gap and has held that gap. There is a small measured next target around 46-47, but I’d lean toward selling any rally now.
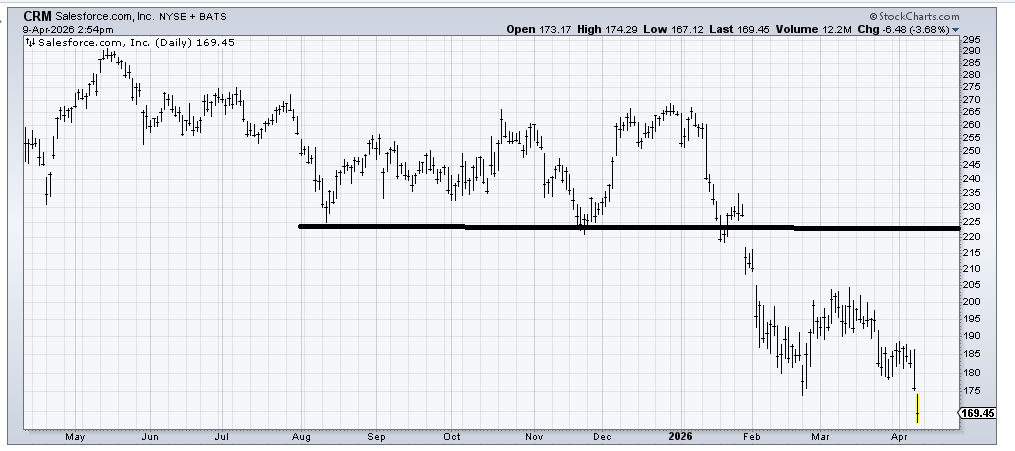
I am not showing the 3-year chart of Salesforce (CRM) because this is the lowest it has been in 3 years. There is a short-term measured target in this 165-170 area. If it can’t bounce from there (it ought to), then the next measured target is in the 155 area.
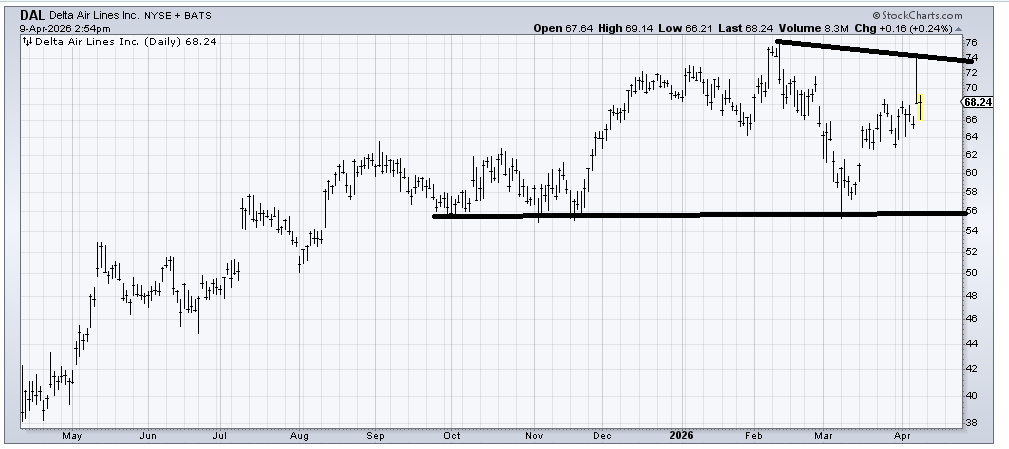
I do not like that spike (and subsequent give up) in Delta (DAL) the last few days, but it managed to fill that earnings gap today, and so I would say it is buyable, but I would use a tight leash and know that the spike high in that 74-75 area will be resistance the first trip up there.
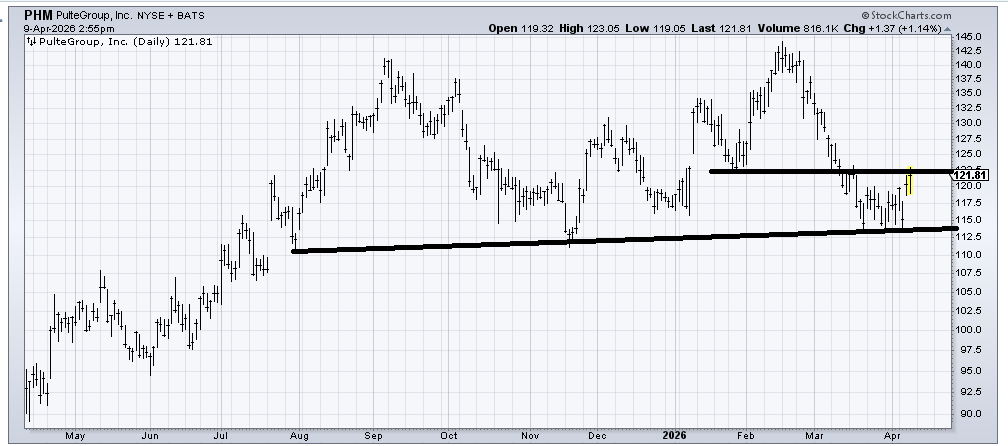
Pulte (PHM) has held this 110-115 area on each trip down here since last summer. So for now, we can give it the benefit of the doubt. A stop under 112 seems far away. I would love to see it pull back into the 118-120 area in the next week or so.
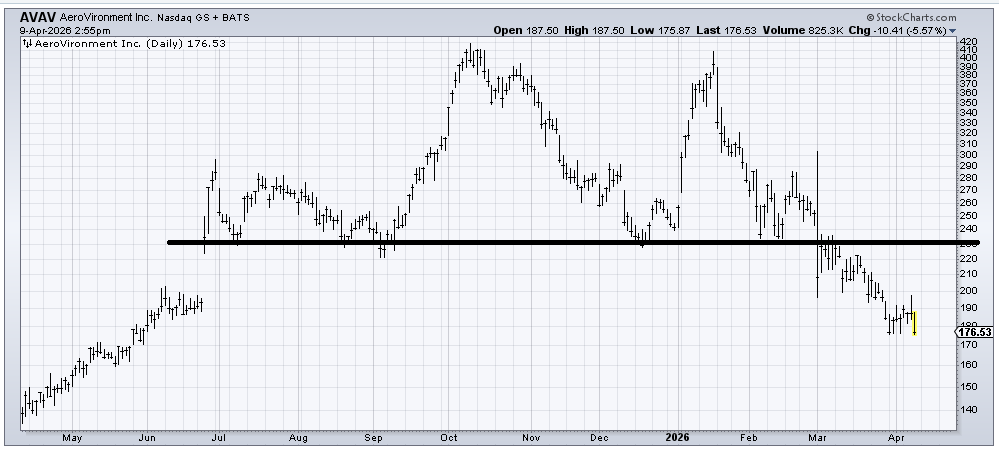
I suppose you can try bottom fishing AeroVironment (AVAV) down here, but I see no sign of a base or a bottom, and that big giant top it broke down from measures to around 130-ish longer term. If it holds here, then you use this as a stop (175-ish).