Mega-Cap Tech Falls Behind as Equal Weight S&P Crosses Downtrend Line
The ratio of RSP to SPY finally breaks the trendline we've been watching and raises questions about whether this rally will ebb and flow or persist.
You've reached your free article limit
You've read 0 of 1 free Pro articles.
Okay, this is it, the chart you have all been waiting for: the ratio of the Equal Weight S&P relative to the S&P crossed that downtrend line I have been drawing in.
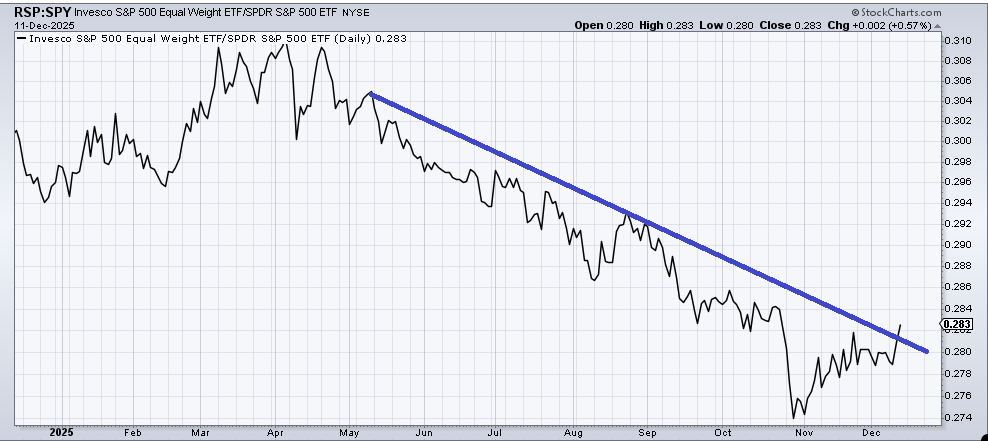
It’s not a major trend change as I have noted before, but it is–at least to me—important that it was finally able to get over the line. One of the things that was quite common when I got into this business over four decades ago was that stocks ebbed and flowed.
You might have noticed I am quite fond of drawing in blue lines to show how I believe a chart might map out, and those lines often show ups and downs, not straight lines. That’s because when I first began putting the pencil to the paper (charting by hand) that’s what happened. So, it’s hard for me to change my view on how stocks ought to trade.
Yet in the last decade or more, we seem to get moves that are much more relentless when they begin. They don’t always ebb and flow. Of course, the times I think they will no longer ebb and flow are exactly the times they do. But that’s markets.
My point here is that for a few months, we have seen the mega-cap tech stocks sit it out or churn. I have harped on this quite a bit. Microsoft, Meta, Netflix (although I’m not sure it’s really a Mag 7 stock anymore), and NVIDIA, to name a few, are all down from their highs, and this latest rally, the one that began at Thanksgiving, has seen them lag. It will be interesting to see if this change we’ve seen from the seven to the 493 ebbs and flows or if it becomes persistent.
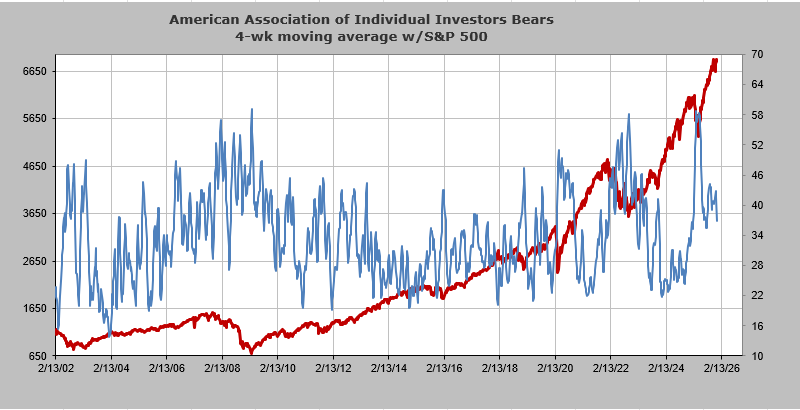
On the sentiment front, the AAII folks have not changed their view at all in the last week. I like to watch the four-week moving average of bears, mostly because these folks jump around like day traders. In any event, based on the math, if the bears stay where they are and do not jump up a lot in the next two weeks, this moving average ought to come down to its lowest level since March. I don’t think it will get under 30% quickly, but it could get there from the current 35%.
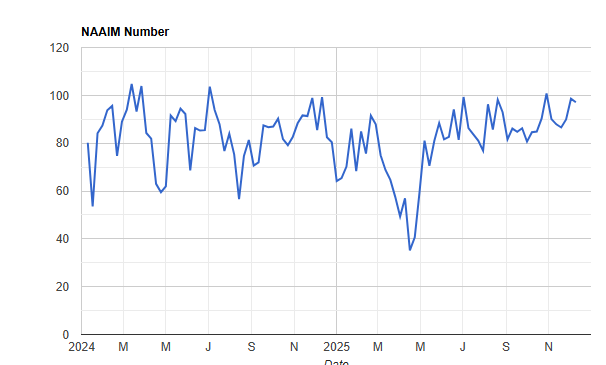
The NAAIM folks also haven’t changed their allocations. Their exposure sits at 97.
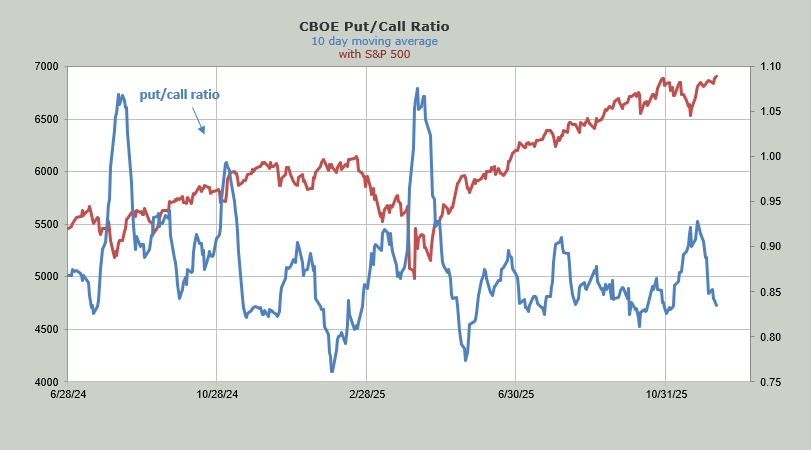
The ten-day moving average of the put/call ratio is now at .84. It was .81 in October, so it won’t take much to get it back to giddy.
Finally, the Daily Sentiment Index (DSI) for the VIX is 13. That’s getting awfully low. The DSI for the S&P is only 79, and Nasdaq is 82. If the Index movers can’t move the index upward, we might not see the indexes get to an extreme, but with the VIX’s reading here, we’ll have to start looking for some volatility soon.