Market Watch: Mag 7 Divide and Semi Stocks Heat Up
The Mag 7 stocks are splitting paths while semiconductors, excluding NVDA, gain momentum.
You've reached your free article limit
You've read 0 of 1 free Pro articles.
The Market
Just in case you thought we were no longer in a market where (NVDA) rallies and sucks the life out of everything else, and if NVDA sits it out, it leaves room for the 493 to rally, that remains the case.
The semis might have been on fire today, but they were on fire without the usual suspects of NVDA, (AVGO) , and (AMD) . Should it bother us that the laggards, such as Texas Instruments (TXN) and Qualcomm (QCOM) , flew higher? Probably, but three weeks ago, I thought the semis were oversold and that NVDA ought to bounce from 170, and that condition has not moved to a fully overbought condition yet. That doesn’t mean I expect non-stop up in this group, but you can see that the Mag 7 have divided, and now so are the semis.
As noted here yesterday, the 30-day moving average of the advance/decline line is now back to an overbought condition. And the VIX wasn’t down very much today, so I still think we are due a bout of volatility.
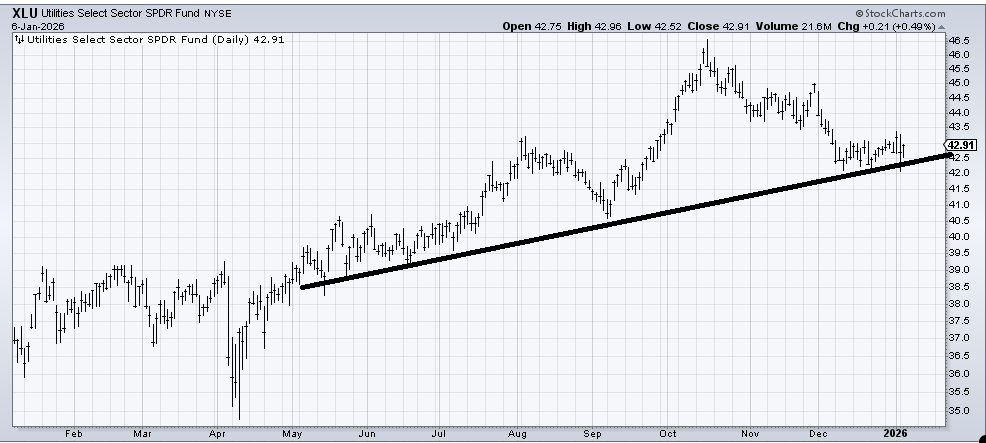
One point I would like to make is that bonds have been flat, as it seems they can’t rally, can’t go down. Yet I still think the Utes are trying to bottom, and now I find myself staring at the charts of some of the homebuilders, wondering if they are due a rally.
When it comes to (XLU) , I am, despite thinking the Utes are basing, going to respect a break of 42 because that would mean a break of the lows of the last month, as well as that uptrend line.
New Ideas
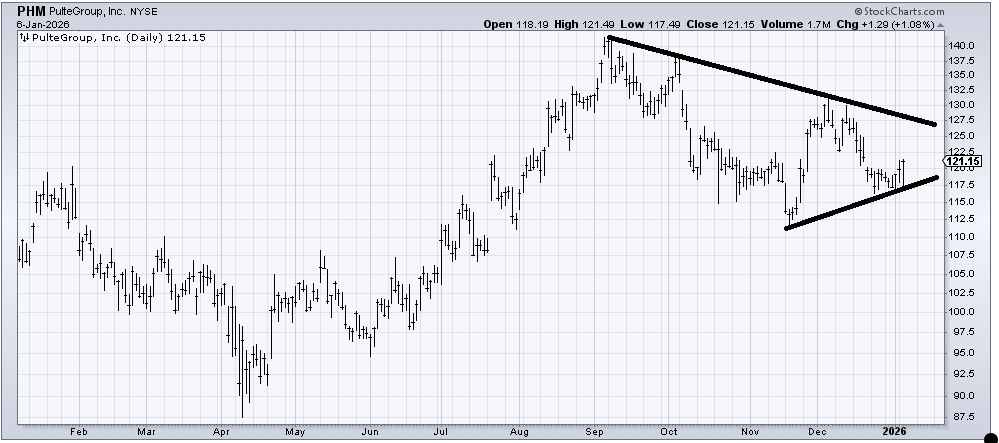
Pulte Homes (PHM) is one of those homebuilder charts that has refused to break down, so as long as that 117 area holds, maybe it rallies to the top of the range.
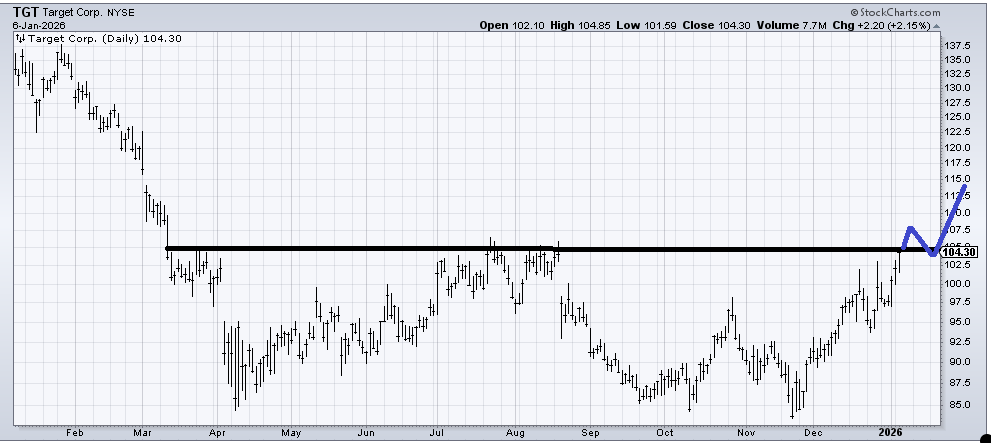
I want to do a follow-up on Target (TGT) , which I have liked since those lows in October. It has finally filled that gap (from August) and is up against resistance in the 105 area. I don’t want to fuss too much because that is a base. What I would love to see is what I have drawn in blue. I’m not sure that’s what we’ll see, but that would make the chart more attractive.
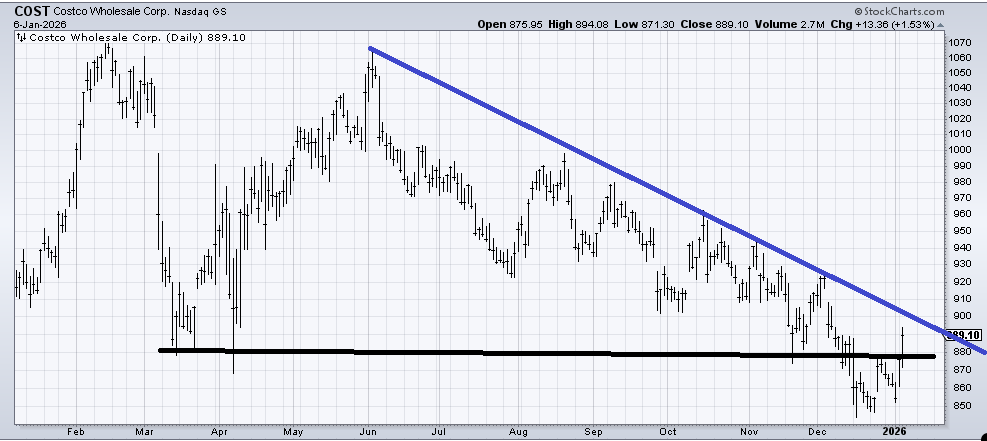
Finally, now that Costco (COST) has crossed back over that 875 area, folks want to know where it can go. There is a lot of resistance all the way back up, starting with that 900 area, so I don’t have a target; this will need to develop. All I know is that I don’t want to see it back under 850 now.
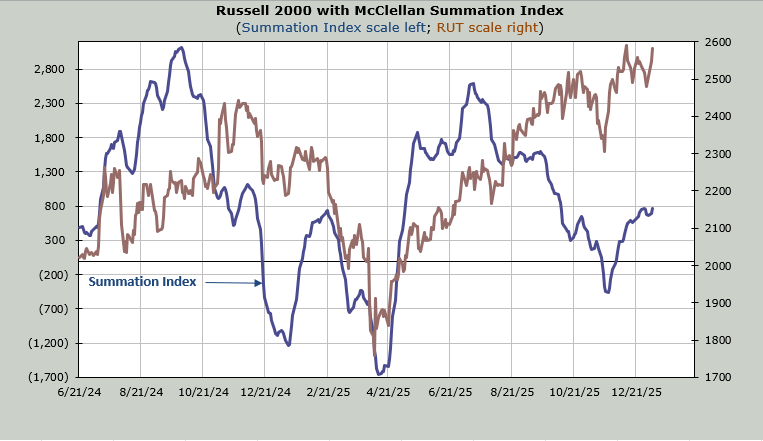
Today’s Indicator
The McClellan Summation Index is pointing upward, and it would require a net differential of -1100 advancers minus decliners on the NYSE to halt the rise.
Q&A/Reader’s Feedback
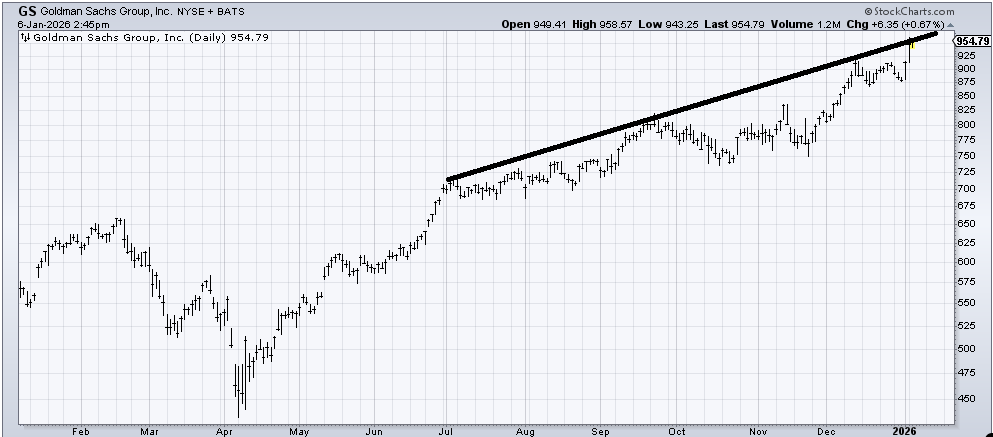
Goldman Sachs (GS) has done nothing wrong. But it is at some resistance, and so I think it will probably go sideways or correct some from here.
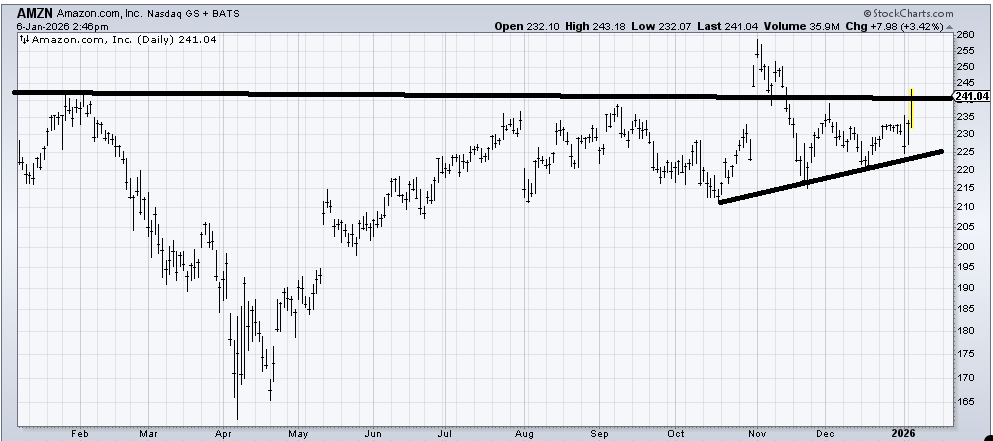
I recommended Amazon (AMZN) a few months ago around 220. It had a terrific pop and then gave it all back. In fact, the stock hasn’t done a thing for a year, but the same reasons I liked it in October would stand today: there is a lot of sideways action that, unless it breaks 225, it seems okay to me. I do think that resistance at the late October high will be problematic, though.
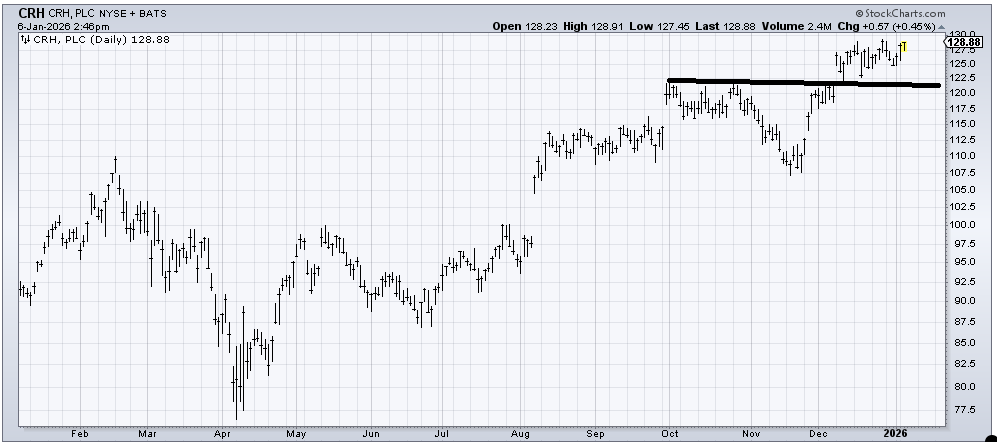
CRH (CRH) has been a great chart, but it’s not my style to buy stocks at the top—I tend to have very little success when I do that (probably because I am a terrible momentum player). The chart measures to the mid 130s, so as long as it stays over 120, it should be okay.
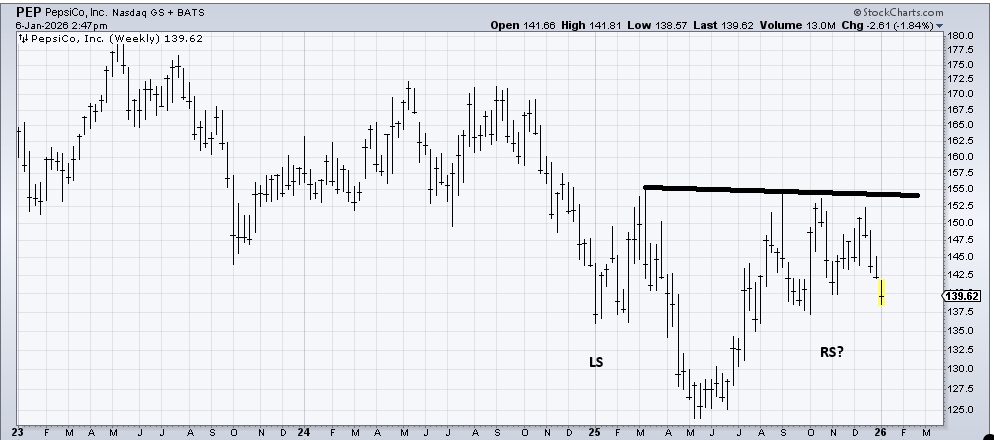
On the weekly chart of Pepsi (PEP) , I continue to see the potential for a head and shoulders bottom. On the daily chart, it has support in the 137-138 area. So unless it breaks that area, that’s how I continue to see it.
I would make one observation, though: all these stocks that pick up activist investors have seemingly lagged. They tend to pop and drop.
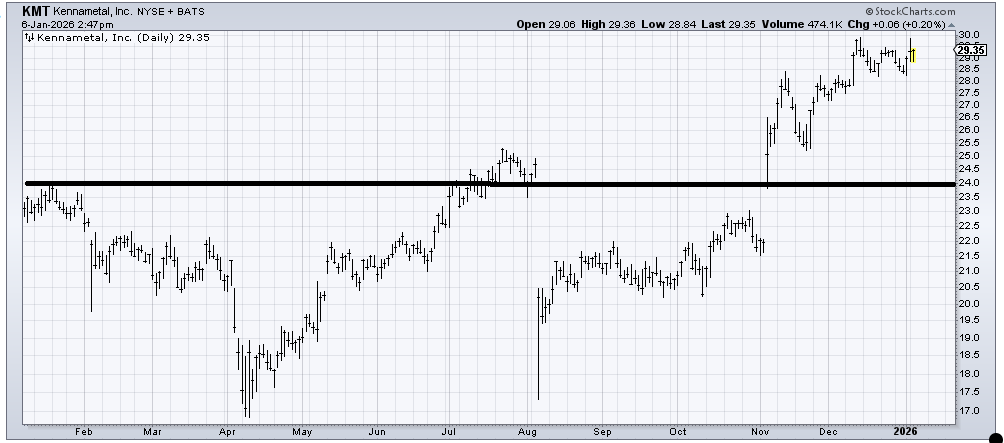
Kennametal (KMT) is not my kind of chart because it is already at the top of the page. There is a measured target in the 30-32 area; otherwise, I’d call it a hold unless it breaks under 28.
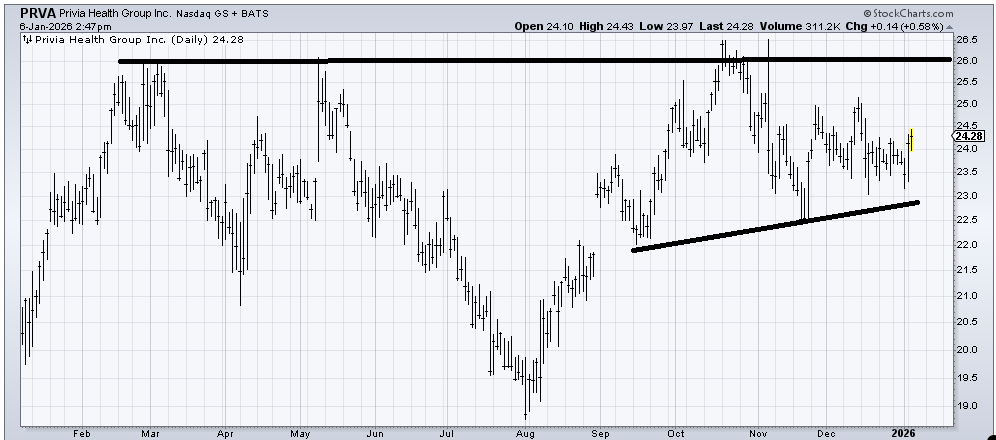
I want to like Privia Health (PRVA) because it has gone nowhere in a year, but all I really see is a trading range for now. Those twin spikes at 26.50 seem like they will be tough (from October/November) because the stock also failed there in the first half of the year. I’d use a stop under 22.50-23.
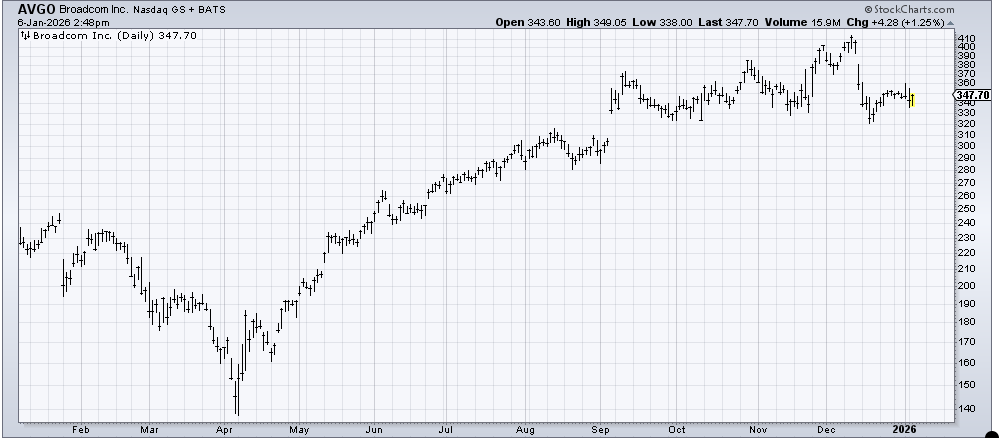
Broadcom (AVGO) looks to me as if a nice whoosh down to fill that gap near 310 would do it some good. It would get folks bearish (a lower low—under 320), and it would tell us if the buyers are really there. When we last checked in on the chart, the stock was around this level, and I thought it hadn’t done anything wrong. It soared and then whooshed on earnings, leaving the stock at the same price it has been since September.
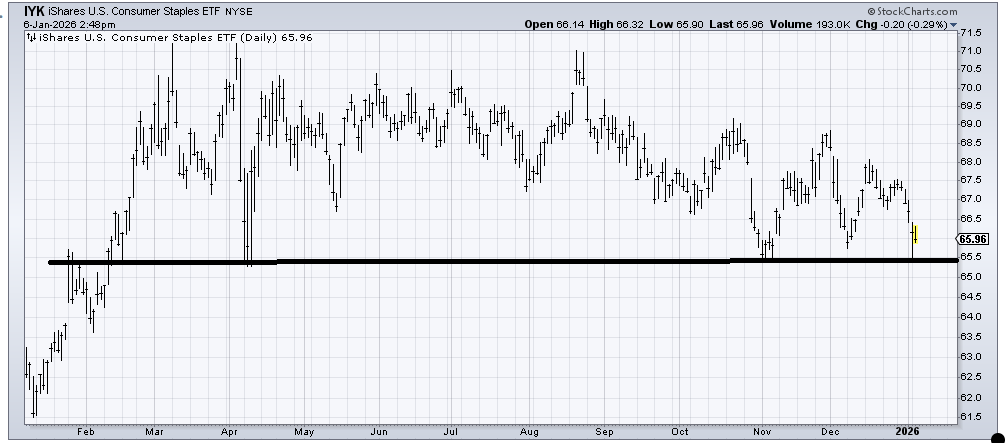
I am unfamiliar with IYK to trade consumer staples since I tend to use (XLP) , and that has a different look than IYK. IYK looks to me like a break of 65.50 would take it down near the January low from 2025. There has been much bottom fishing in these names, mostly to no avail.
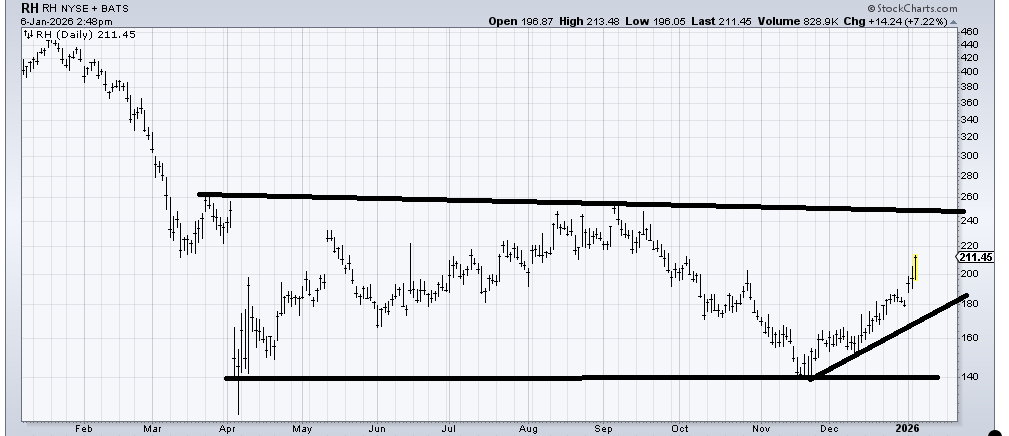
RH (RH) remains in the same trading range it has been in since April last year. My only question is if we will see it break in one direction or the other. For now, I don’t have a strong feel on that, so I’d continue to play the trading range. If it pulls back and doesn’t return to the 140 area but bounces off this small uptrend line, I might lean toward a breakout to the upside over time.
Helene welcomes your questions about Top Stocks and her charting strategy and techniques. Please send an email directly to Helene with your questions. However, please remember that TheStreet.com Top Stocks is not intended to provide personalized investment advice. Email Helene here.
