Major Indexes Hold Up but Underneath Stocks Struggle
We’re back to an Either/Or Market.
You've reached your free article limit
You've read 0 of 1 free Pro articles.
The Market
I’d love to tell you that today was a great day in the market but I can’t. Because in case you were living under a rock, today was definitely an Index sort of day.
Breadth was negative. Net volume was negative and heck, Nasdaq, where we are pennies from a new all time high, had more stocks making new lows than highs.
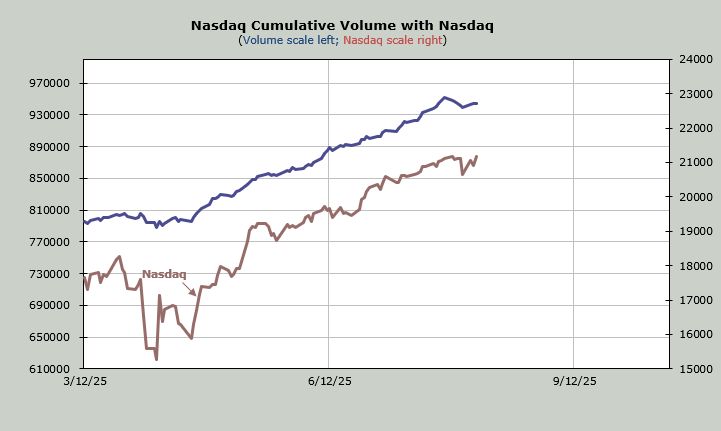
Here’s one chart to watch in the coming days. This is Nasdaq Cumulative Volume. I calculate it as we would the cumulative breadth (advance/decline line) but I use up and down volume. Notice the shape of the blue line (volume) since the lows: literally nothing but up. It didn’t even have a breather in May when Nasdaq had that dip.
Could that be the penny stock traders skewing it? Sure but let’s not rationalize it. Let’s now notice that we may for the first time since the lows be witnessing a divergence where Nasdaq makes a new high and volume doesn’t.
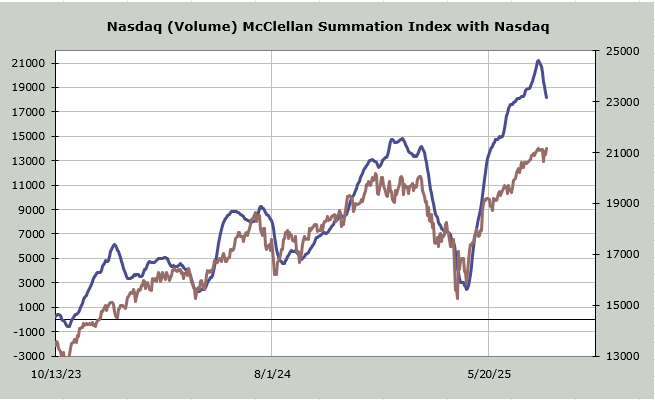
Sticking with Nasdaq Volume, when we use volume statistics for the McClellan Summation Index on Nasdaq we can see that this too did not have one stutter since the lows. But in the last week it has turned down. Today did not help. It now needs a net differential of +9.5 billion shares (up minus down) to halt the decline.
The good news is we entered the week with this at +14 billion (discussed here Sunday evening) and now we need +9.5 billion shares but there is a change underfoot that has not been present since April.
Basically we’re back to an Either/Or Market. The major indexes may hold up but stocks are struggling underneath. And if breadth has a good day, then the megacaps sit it out.
New Ideas
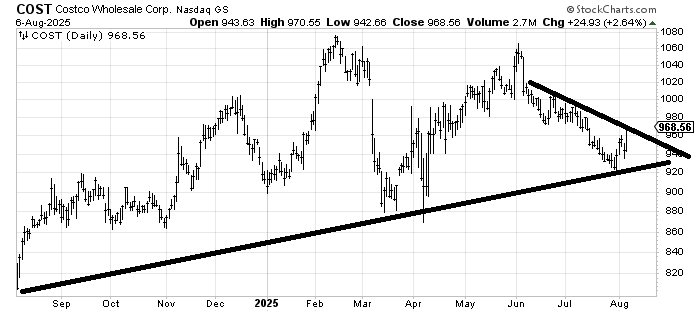
I was asked to follow up on Costco COST now that it finally bounced. But look at that: it’s at resistance already. Even if it gets through it’s got resistance all the way up so I would just use a trailing stop. Back under that lower line and it is not good for the stock.
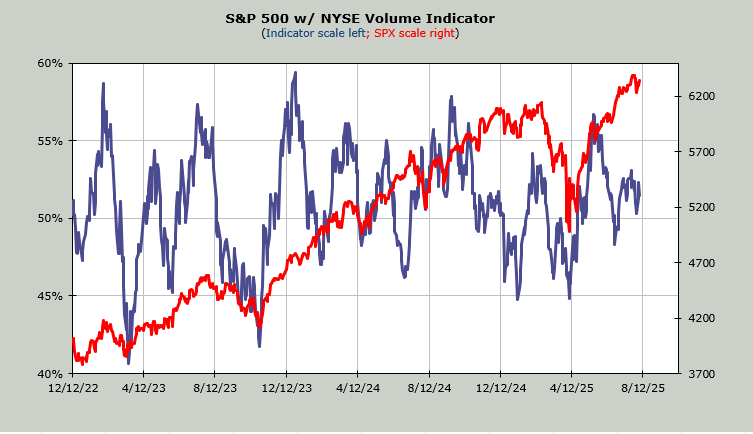
Today’s Indicator
The Volume Indicator hasn’t budged in weeks. It remains overbought at 51%.
Q&A/Reader’s Feedback
Helene welcomes your questions about Top Stocks and her charting strategy and techniques. Please send an email directly to Helene with your questions. However, please remember that TheStreet.com Top Stocks is not intended to provide personalized investment advice. Email Helene here.
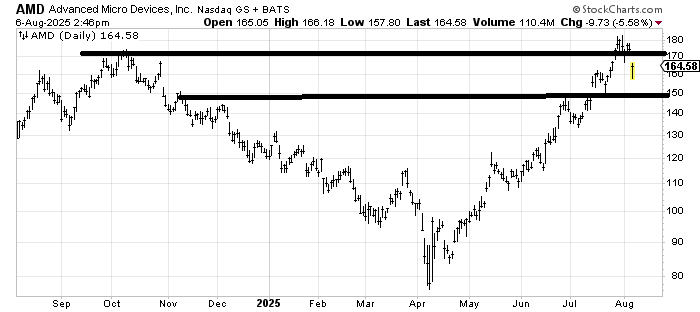
Advanced Micro Devices AMD is a stock I thought would do this sort of pullback a month ago. I think there is decent support around 150.
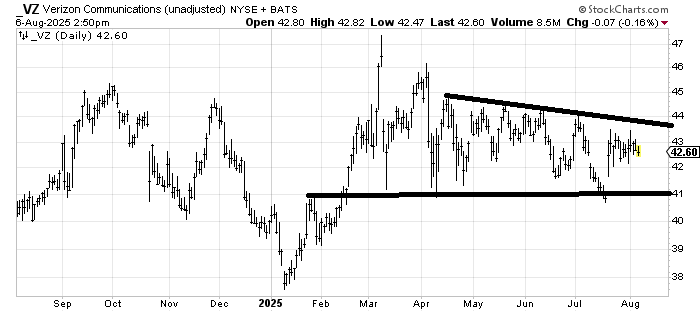
We looked at Verizon VZ a few weeks ago when it was at 41 and I thought it was oversold enough to bounce but look at it: it hasn’t made a higher high since early March. It continues to look to me like it is just in a trading range. The way a utility used to look!
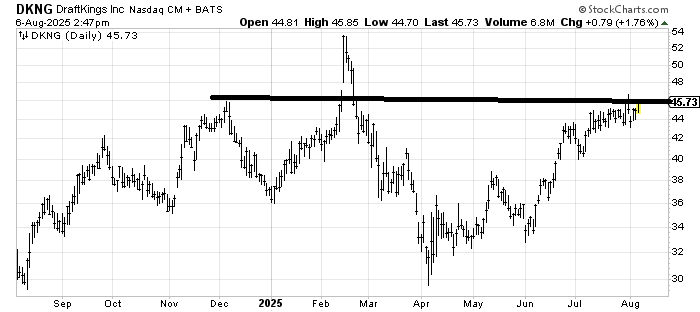
DraftKings DKNG is sort of interesting here. If it can get over that spike high from last week I would think it makes a try for the old high. I don’t want to see it back under 43 though.
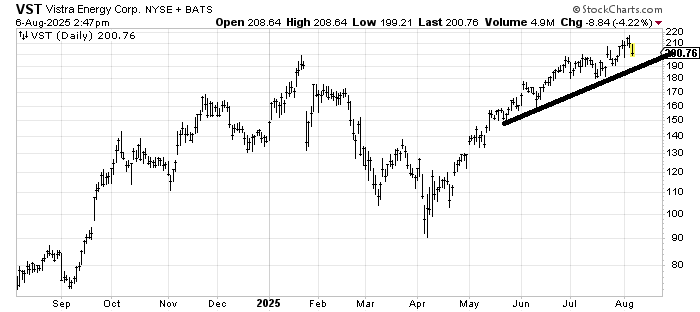
Vistra VST is not my kind of chart but unless/until it breaks under that uptrend line it hasn’t done a thing wrong.
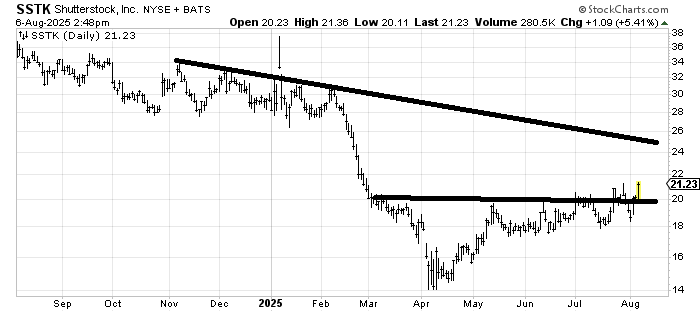
Shutterstock SSTK has a nice little base and not much in the way until 24-26.