Looking for That Big Pullback? This Is All I Can Give You Right Now
Here's what's going on (and what isn't), but before we can even look for any sort of 'good' downside this needs to happen. Plus, a look at Amazon, UnitedHealth, Amgen and more.
You've reached your free article limit
You've read 0 of 1 free Pro articles.
The Market
I get that the market has slowed down. I get that everyone wants it to "do" something. I also get that most are ready for a real pullback. The best we have gotten is chop.
We are short-term overbought but my work says we won’t be intermediate-term overbought until sometime late next week. That doesn’t mean we will turn on a dime and head down. If the indicators roll over then I would expect a significant pullback in June. This is why I keep harping about the indicators this week.
You might recall how we kept getting down days with 87% down volume or even 88% and I insisted on being a stickler, waiting for 90%. That’s what I do. It doesn’t always work out perfectly but before we even look for any sort of "good" downside we should look for the indicators to roll over.
The McClellan Summation Index needs a net differential of -2,000 advancers minus decliners on the NYSE to halt the rise. So it needs at least a good day or two on the downside to do that. Otherwise, up is up.
The NYSE Hi-Lo inched up Thursday although the new highs aren’t much to write home about. The Nasdaq Hi-Lo has rolled over and thus far this week’s uptick has been pathetic. So this one can go on the negative side of the ledger — if it is still at a lower high a week from now.
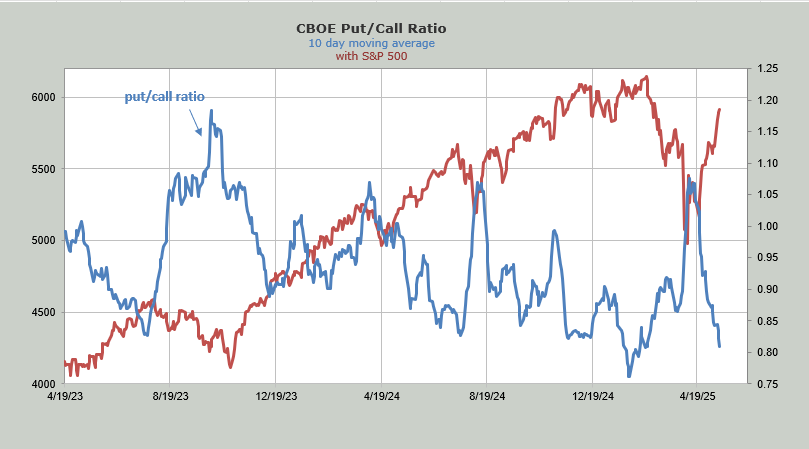
The indicators I do have that are flashing warning signs have more to do with sentiment (and short-term overboughtness) than anything else. The equity put/call ratio was 0.41 on Wednesday. That is the lowest since mid-January. It still took another two to three weeks for the market to roll over. Prior to that it was 0.39 in mid-August 2023. It took about another week for the market to care and roll over.
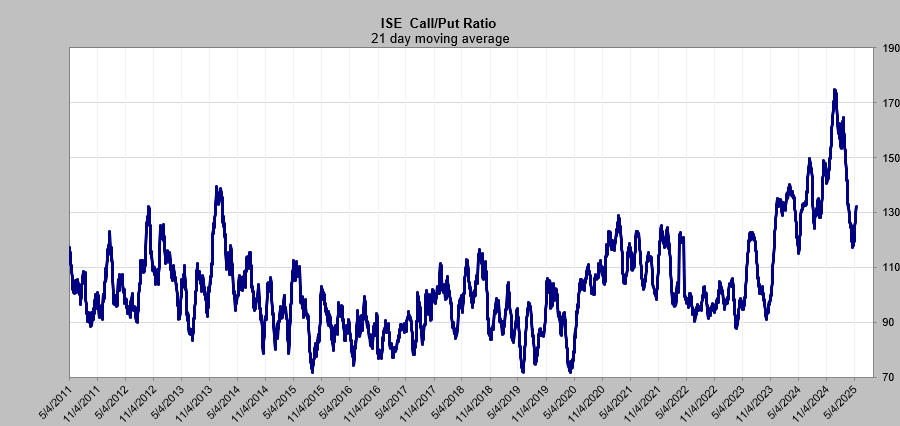
The 10-day moving average of the put/call ratio is now quite low. But it hasn’t curled upward yet. The chart is shown below. Even the ISE call/put ratio’s 21-day moving average, which I noted a few weeks ago needed to lift because even it had finally showed too much bearishness, has pushed itself back up over 1.30, which by historical standards is high.
The DSI for the S&P 500 is still 77. The Nasdaq is 79 and the VIX is 19 so those three are not extreme but knocking on the door of extreme.
The AAII survey showed bulls up by six and bears down by the same amount, but there are still more bears than bulls. The NAAIM survey surprised me the most by ticking down to 70 from 81.
We haven’t had a real down day since May 6th. I will continue to monitor the indicators to see if they roll over, especially if we get a real down day.
New Ideas
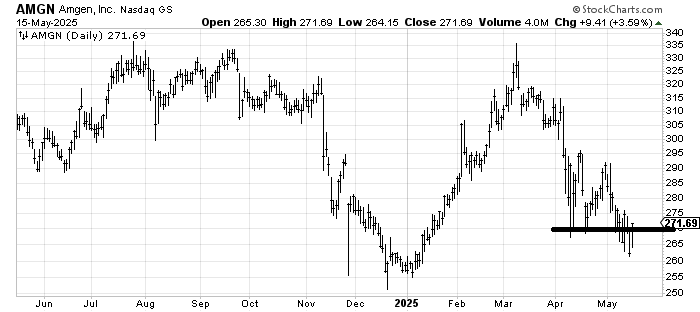
I was asked about Amgen AMGN a week or so ago and I noted that I kept looking for a reason to warm up to it and hadn’t been able to. I figured a stop under $270 was warranted. I have a view that when Amgen breaks a level and snaps right back over it, it’s time to take a look at the chart on the long side. I think it is early but I’m warming up to it now. There is a lot of resistance to chew through but the pencil feels better.
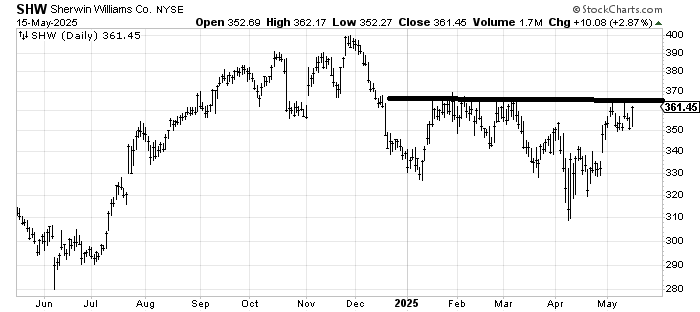
I was asked to take another look at Sherwin-Williams SHW, which I thought might make a run in February and instead it went plop. It certainly has improved and a move over that $365-370 area would be a nice breakout. Under $350 and I am wrong.
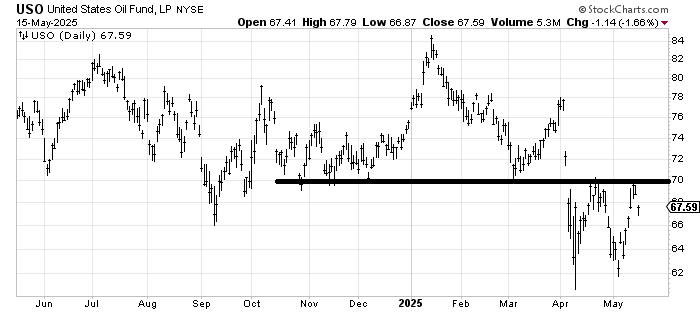
Lastly, I was asked to follow up on United States Oil Fund USO, or oil itself. USO got to resistance at $70. I thought after a small pullback it might try to fill that gap near $72. I think it rallies again but if it can’t get over $70 by the end of next week I would say it’s back in the range.
Today’s Indicator
The 10-day moving average of the put/call ratio is discussed above.
Q&A/Reader’s Feedback
Helene welcomes your questions about Top Stocks and her charting strategy and techniques. Please send an email directly to Helene with your questions. However, please remember that TheStreet.com Top Stocks is not intended to provide personalized investment advice. Email Helene here.
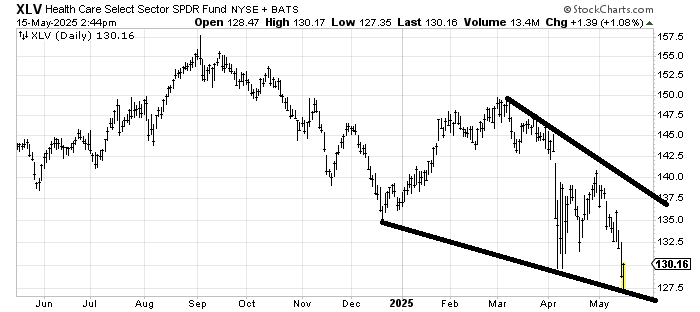
The question is if Health Care Select Sector SPDR Fund XLV will ever bottom. I can tell you there is no base to speak of. But I can also tell you that XLV had a measured target of $125 and it got to $127-ish Thursday so it ought to start trying to bottom.
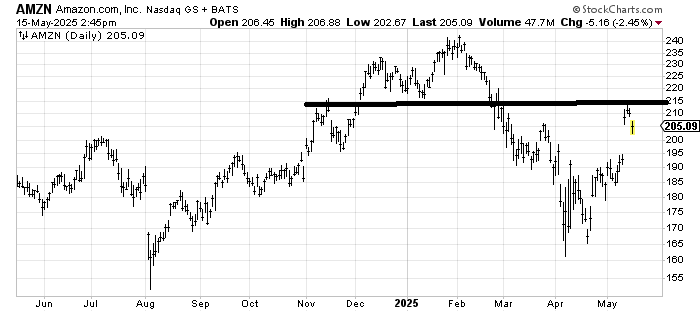
When I first thought Amazon AMZN was due for a rally I set my sights on $215-220 as the target. It finally got up there this week. But I don’t love the action this week so I would take some profits. However, let me say that my guess is the stock has another rally attempt; I’m just not sure it will get much over $215-220. If it comes all the way down to $195 to fill the gap at least the runway is longer.
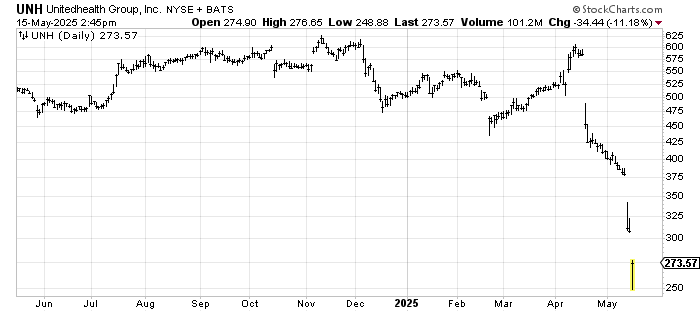
UnitedHealth Group UNH looks like a disaster but it is oversold. That’s the best I can say about it. Unless it gaps up over $300 leaving Thursday as an island, there is a lot of work to be done to repair this chart. The top measured to $325 and earlier this week I would have thought it hit the measured target; now it has blown through it.
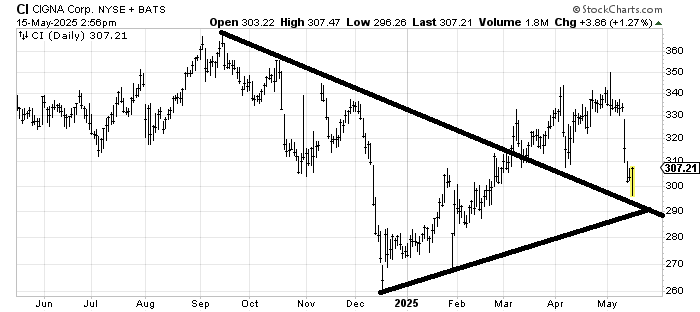
If you want to bottom fish in this group, at least Cigna CI has bounced from support. Seems a better, less risky play.