Looking for a Short-Term Rally, While Lowering the Panic Point for Nvidia
Short-term indicators suggest a rally, but I'm not sure conditions are right for it to last.
You've reached your free article limit
You've read 0 of 1 free Pro articles.
 Analysts at Stock Exchange
The Market
As you know, I have been looking for some sort of break in the market that brings about panic. I don’t think we’ve gotten that yet. Mostly, we have gotten a drip, drip, drip market.
On a short-term basis, there is no doubt that we are getting oversold. On Thursday evening, I showed you what it will take to turn the currently downward trajectory of the McClellan Summation Index from down to up. Breadth was red but benign on Friday, so that number remains at +4200 advancers minus decliners on the NYSE.
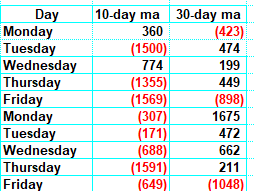
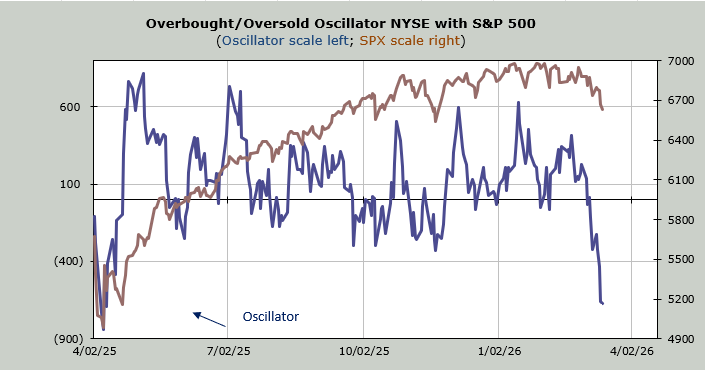
My own Overbought/Oversold Oscillator, which is based on the ten-day moving average of breadth, will be oversold this coming week. The last seven trading days have seen breadth negative. And eight of the last ten have been negative. When we have a long string of negative numbers to drop, we are oversold. Notice how much red is to be dropped starting later this week. (more on the 30 dma down below)
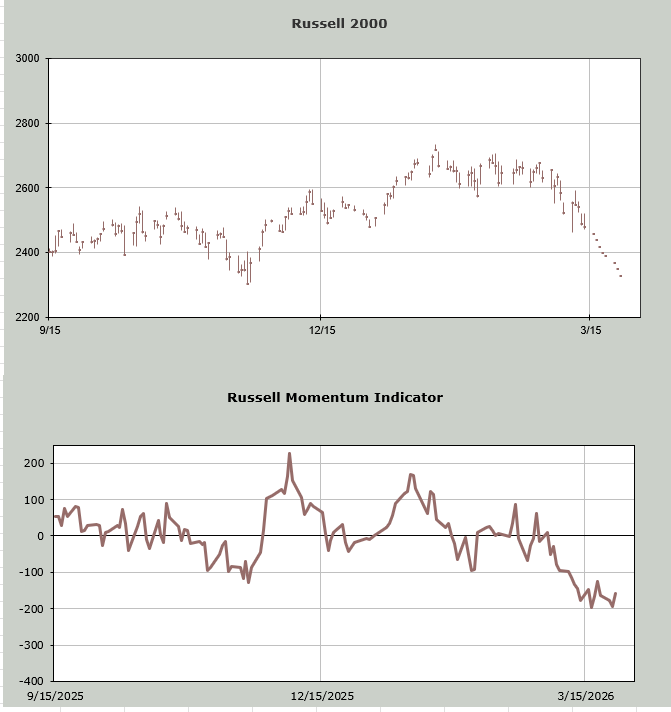
The Momentum Indicator for the Russell 2000 will stop going down and start heading upward later this week as well. Nasdaq does not show the same, but remember the selling for most of the last few weeks has come in the 493, which the Russell represents much better.
Now let’s move on to the more intermediate term. The 30-day moving average of the advance/decline line is my intermediate-term oscillator, and you can see from the table above, there is very little red to drop there. That will be the case for the next few weeks. The chart will be shown here Monday evening.
The Volume Indicator is heading toward an oversold condition, but it too needs more time (and price movement). The current reading is 48%. In bull markets, it tends to bottom around 47% and in bear markets in the lower 40s.
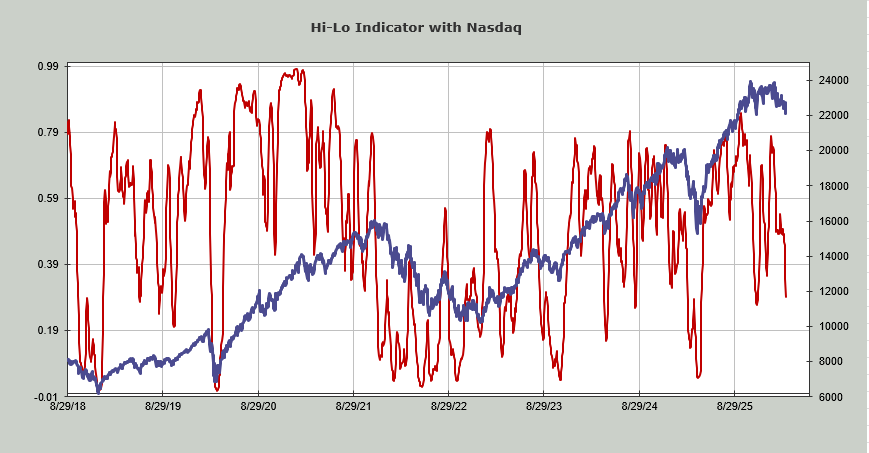
The NYSE Hi-Lo Indicator is currently at .50 which is not oversold either (under .20 gets us there). The Nasdaq Hi-Lo Indicator is much closer to an oversold condition at .29 (under .15 gets us there). The chart is shown below.
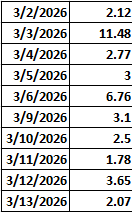
Sentiment-wise, we know about the options ratios showing a lot of put buying but no extremes yet. I do not have a chart, but there is something I have noticed I want to highlight. The options on the Russell 2000 don’t trade a lot (volumes tend to be lighter than, say, ETFs or equities), but since March 2nd, the put/call ratio for the Russell has been quite high. All but one of the readings is over 2.0.
To put that in perspective, dating back to the first day of 2026, there were only 7 other days where the reading went over 2.0. Here’s the table:
The more intermediate-term sentiment indicators are all ‘on their way’ to showing too much bearishness, but none are really extreme yet. We have looked at the Investors Intelligence (still more bulls than bears but have moderated quite a lot), the AAII with more bears than bulls but not extreme yet, and NAAIM, which has shown a meaningful shift down (to 67 from 100) but not close to an extreme.
To those, I can add the Market Vane Bulls are still at 62; they were 41 in April of 2025. The Consensus Inc Bulls are at 71, and they were 42 in April of 2025. The DSI for the S&P is now 33 (it was in the high 80s in October, what I call peak giddiness). A single-digit reading, or even one under 15, shows me real fear. Nasdaq is still at 40.
I think we get an oversold rally this week, but on an intermediate-term basis, my best guess is that after that rally, we’d have to come back down because the only extremes are in the short term. To wrap this up, for weeks I have said it was the 493 that were overbought. Based on those options ratios for the Russell being so extreme, I’d guess the rally would be exacerbated in the small caps/493.
New Ideas
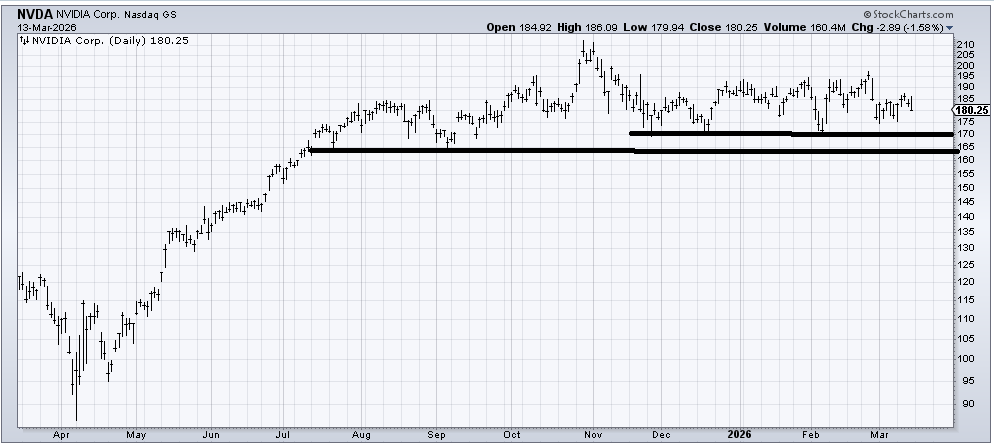
For months, I have been advocating that as long as NVIDIA (NVDA) stays over 170, it is okay. I want to revise that today. I am going to widen the range to 165. I now wonder if breaking 170 would cause some panic, but the support would then be 165.
Today’s Indicator
The Hi-Lo Indicator is discussed in full above.
Q&A/Reader’s Feedback
Helene welcomes your questions about Top Stocks and her charting strategy and techniques. Please send an email directly to Helene with your questions. However, please remember that TheStreet.com Top Stocks is not intended to provide personalized investment advice. Email Helene here.
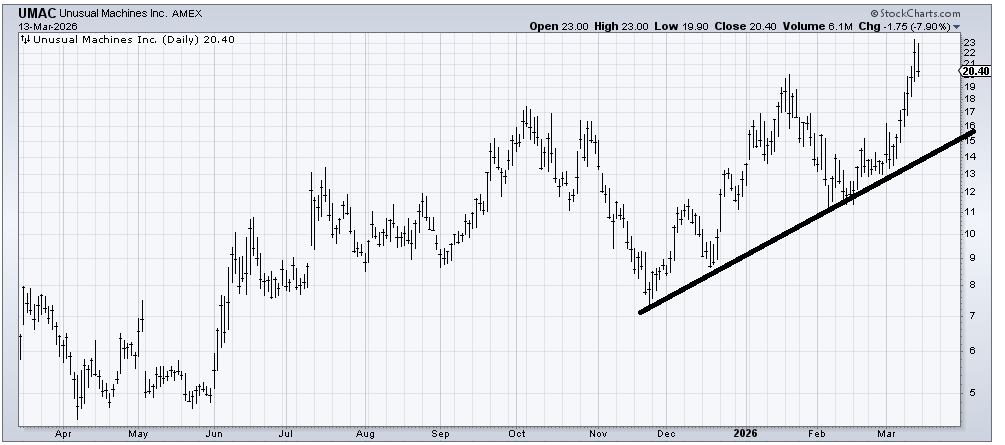
Unusual Machines (UMAC) has a tendency to make a higher high and then go into a multi-week correction (see July, October, and January). If that pattern persists, then I would expect it to tag that uptrend line a few weeks out in time and start to hold for a decent entry with a decent risk/reward.
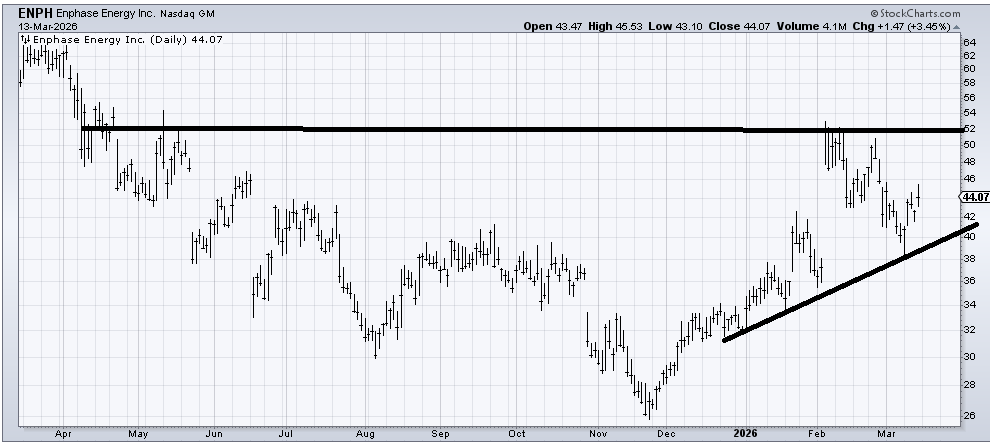
There are so many gaps—up and down—on the chart of Enphase Energy (ENPH) that it is hard to determine which way the next gap will go! Mostly, I see a chart trying to base. Another trip down to that 38-40 area that holds would make this more interesting. I do not want to see a break under 38, though.
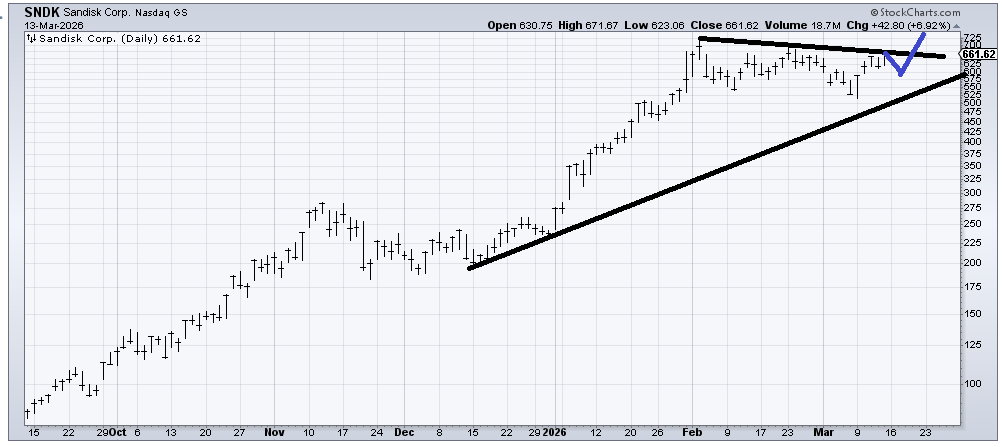
Sandisk (SNDK) has clearly corrected over the last six weeks. So now if it can break out over that line, it would be a positive. Because I love symmetry (it’s a flaw I have!) I would love to see the pattern shape up something akin to what I drew in blue.
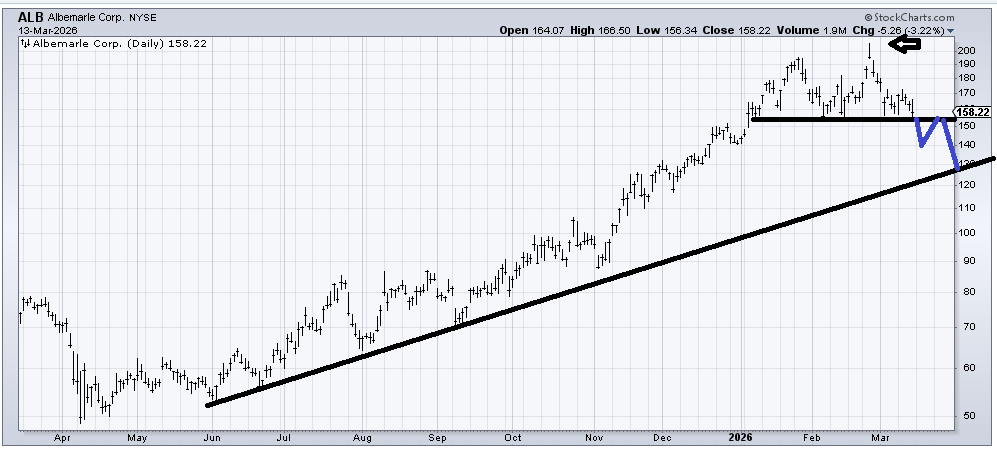
Albermarle (ALB) seems to have generated an island top (arrow) in late February, and if it breaks that 152 area would then measure toward that uptrend line. Due to the market’s short-term oversoldness, I would say if it breaks, it would likely map out as I have drawn in blue.
Related: We're Tracking 24 Portfolio Signals Across 9 of Our Investing Themes
