Looking Back at Other Periods With So Few Bulls
We've had similar periods to today in 1994, 2008, 2015, and 2016. How did the market react?
You've reached your free article limit
You've read 0 of 1 free Pro articles.
The Market
Last night I noted that a down day today, that then rallied again, would probably change the sentiment. Anecdotally, the reversal today has helped a bit. But we are just not yet seeing it in the data.
The put/call ratio was .82 today, so sure folks are buying the dip. But my point is that after we get an overbought reading, the market should go sideways (it has) and then rally again. Everyone who thought we should head right back down then ought to start changing their view on the market. That’s the fence sitters that convert from bear to bull.
Now we have the mega-cap stocks up on earnings after hours, and the chatter is getting quite bullish. Let’s see if the statistics can match that chatter. I think it takes a few more weeks to do that.
This week, we saw the Investors Intelligence bulls move up five points to 28.8%. It’s not much, but it is a directional change. However, there are still more bears than bulls, so this indicator is still on the positive side of the ledger.
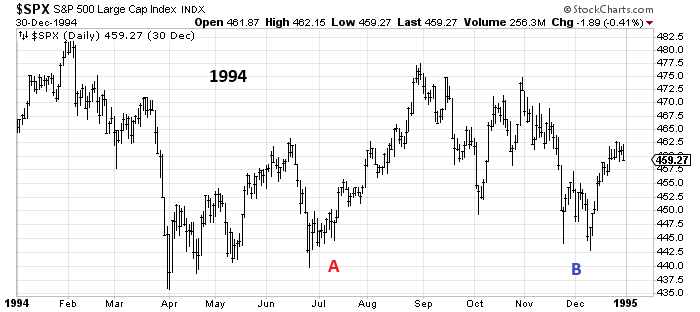
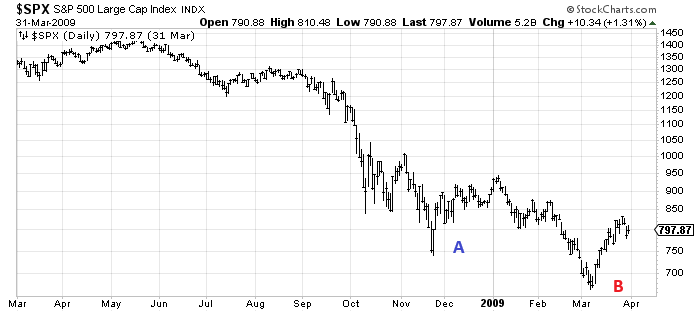
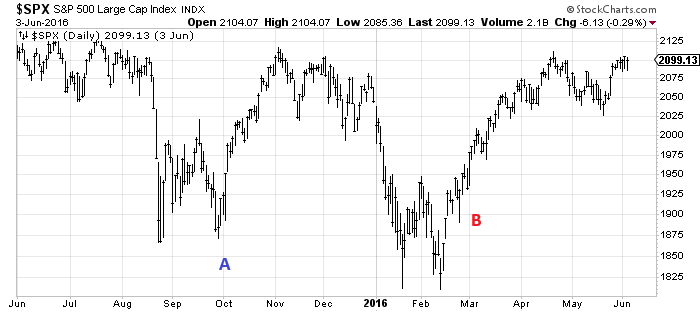
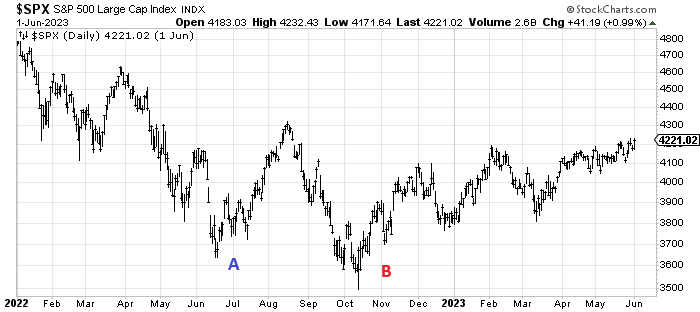
In fact, let’s take a look at the ten-week moving average of bulls. It has sunk to 30%, which is quite a feat as you can see. Since 1994, it has only gotten down here a handful of times. Oddly, the last two times it did so (2015/16 and 2022) it ‘double tapped’. So, I decided to look at those four prior periods: 1994, 2008/09, 2015/16, and 2022. What I discovered was we got some nice rallies off those readings. (the red A on the charts) But in every single case, we came back down several months later (blue B on the charts). I was surprised at this.
Because the market was so terrible in 2008, the rally off Point A doesn’t look great, but it was nearly 20% and lasted about six weeks or more. But eventually, it sank to point B before it ended.
In 2015-16, the rally looks more impressive, but it was in fact only about 8%. But we did come back down.
Finally, in 2022 we rallied 16% before heading back down to point B.
So, when you see a move down as we had in the morning today, know that I still think it is too soon to come back down now. The indicators are not set up for it. They are set up for chop, or if we get the index movers going, up. But mostly the charts have been sideways for a week now as we work the short-term overbought condition off.
New Ideas
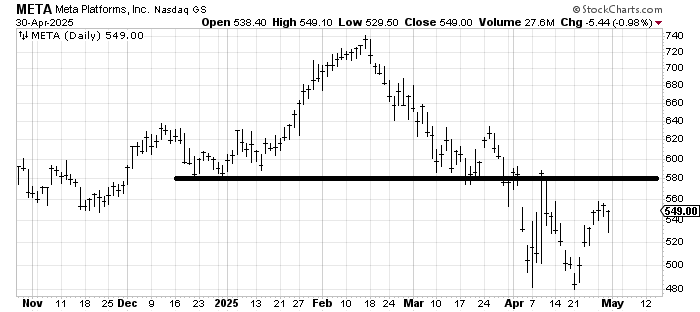
I have no strong view on Meta META, but I would note that the first trip up to resistance at 588 was that Wednesday, April 9th, so that’s going to be resistance again should it get up there.
But it’s energy I need to highlight because the DSI got to 10. If everyone wasn’t spending so much time yapping about the GDP and tech stocks, they might have fussed over energy more today. Let’s be on our toes and look for a trade in the next few days.
Today’s Indicator
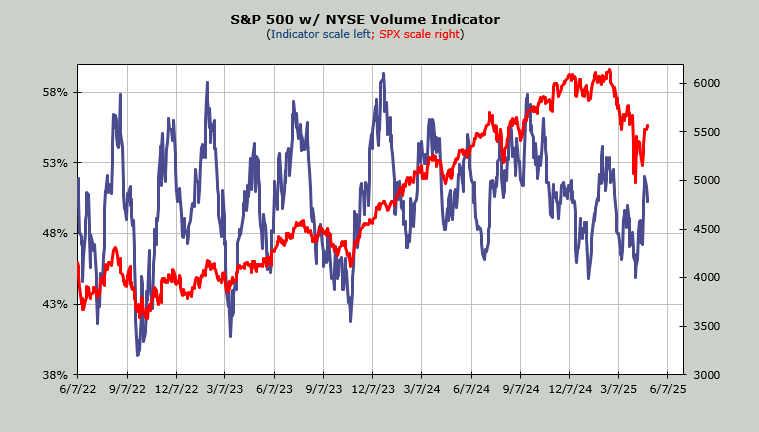
The Volume Indicator is at 50%. It’s neutral for now.
Q&A/Reader’s Feedback
Helene welcomes your questions about Top Stocks and her charting strategy and techniques. Please send an email directly to Helene with your questions. However, please remember that TheStreet.com Top Stocks is not intended to provide personalized investment advice. Email Helene here.
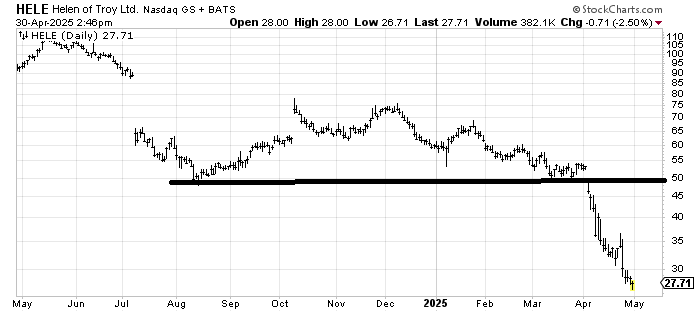
The best thing I can say about Helen of Troy HELE is that the breakdown at 50 in April measures to 25-ish, so it ought to find some stabilization in that area. But there is no base to speak of, so aside from that, you’re grasping at straws.
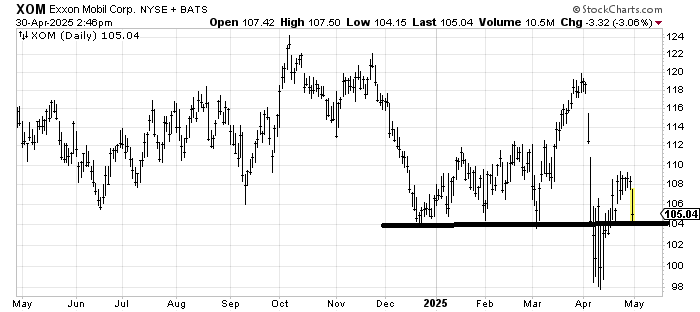
I am a believer that spike lows tend to hold on the first trip down so that would be the case for Exxon XOM. It doesn’t mean the stock should then runaway on the upside, it just means that with the DSI on crude oil at 10 and XOM is not at a lower low then I would think it is worthy of a trade.
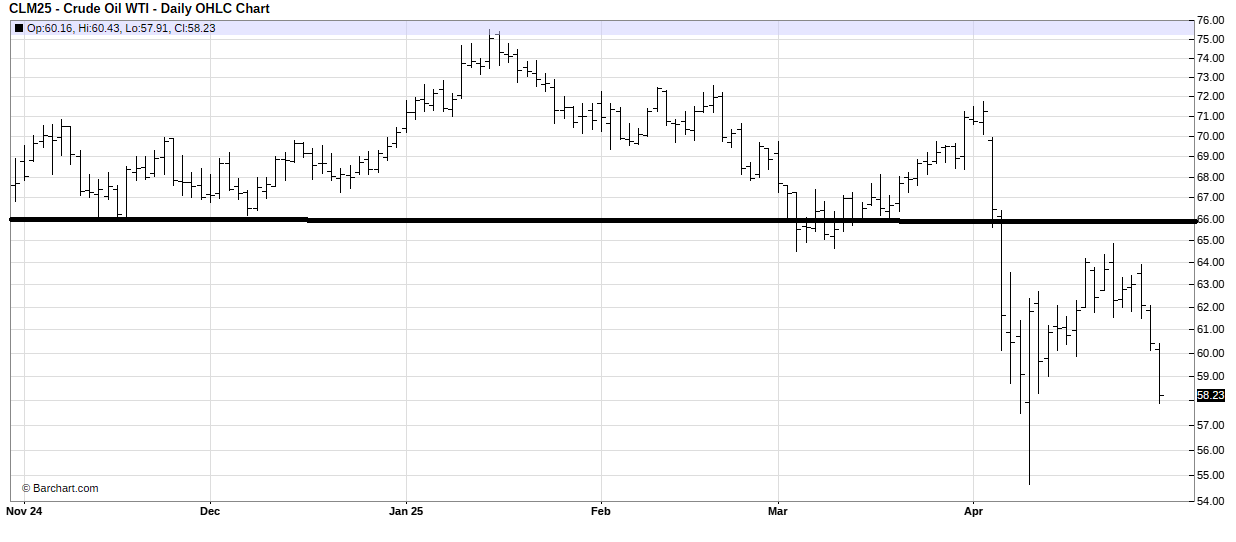
The same discussion about the spike low in Crude Oil would apply as to Exxon above. That top measured to 56 which is where it bounced from in early April. Now with the DSI at 10 we are close to a bounce.
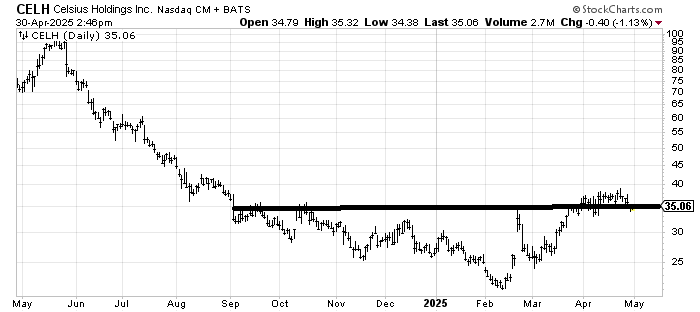
I should like the attempt at a bottom in Celsius CELH, but I look at that breakout over 35 and wonder why, if it was a breakout, did it rally and die so quickly? Why did it not participate in the April rally? So if it breaks this 34-ish area, it will look like a fake out, not a breakout.