Let's Talk About the Change in Sentiment
Is it the war? Or something else? Whatever it is, there's been a change in how investors are viewing the market.
You've reached your free article limit
You've read 0 of 1 free Pro articles.
 Market Sentiment
The Market
Well, there was definitely a change in sentiment today. I’m not quite sure why it was today, but today seemed to be the day. Was it panic? No. But it was a change.
For example, folks who were very casual about the war a week ago had a rethink about it and are now concerned on the impact of (quite frankly, we can fill in the blank here, be it energy, inflation, the economy, you name it).
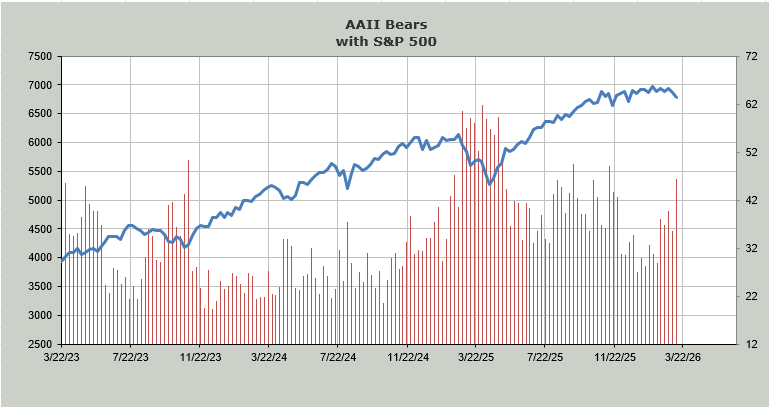
We can see the shift in the AAII survey. The bulls stayed steady, but similar to the Investors’ Intelligence readings we got yesterday, the bears got frisky, rising eleven points to 46%. That’s the most since the November low. So, we’re getting somewhere.
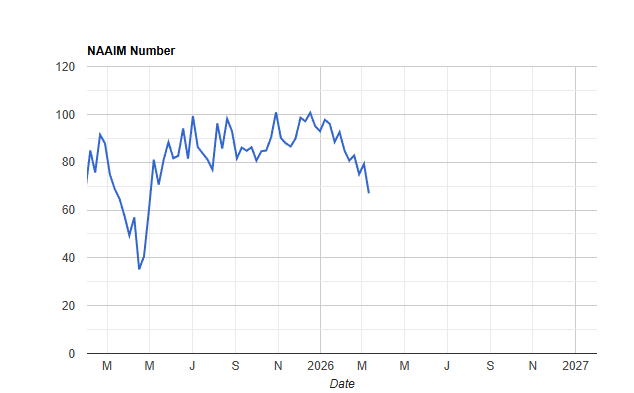
Then there are the folks at NAAIM who have been rather steadfast in their exposure to the market. They have barely dipped under 80 since they got panicky at the April low last year (and brought their exposure down to just under 40). Now they are at 67. Again, we’ve finally seen some movement.
Anecdotally, the banks/financials seem to have become the talk of the town today as everyone seemingly decided today was the day to get concerned. I suppose the fact that they came into the year loving banks and have seen most of them fall by at least 20% is what has changed their view.
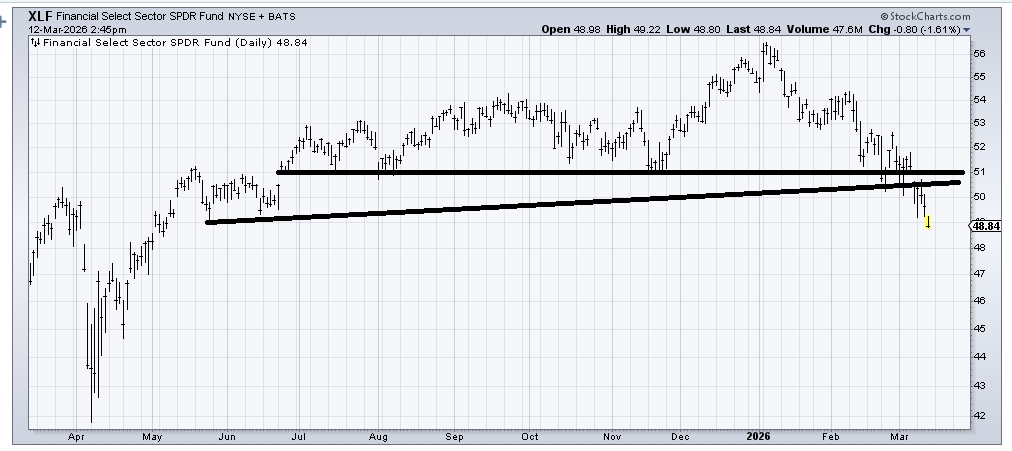
I have been harping about the banks and financials for months and will continue to do so. The selling has not been panicky; it is more relentless than anything else. Down below I review the chart of the XLF once again.
Now let’s talk about getting oversold. My own Oscillator will get short-term oversold next week. The Nasdaq Momentum Indicator still shows me no sign on that score, probably because it was the place folks wanted to be for the last two weeks, as they gave up on the 493.
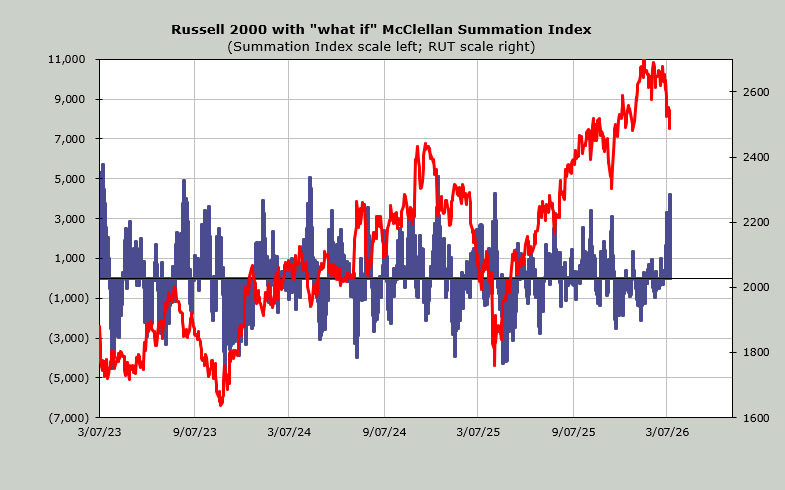
The McClellan Summation Index is heading down and has been picking up steam all week. It now needs a net differential of +4200 advancers minus decliners on the NYSE to halt the decline. That makes this indicator oversold.
I know folks hate declines like this, but clean-outs when they arrive tend to give us good opportunities. How do I know we’ll get there? Because in my 40+ years of doing this, we always have. It’s never different this time; there’s just different twists.
Lastly, I had a chat with the folks at Tastytrade today about sentiment. You can watch it here:
New Ideas
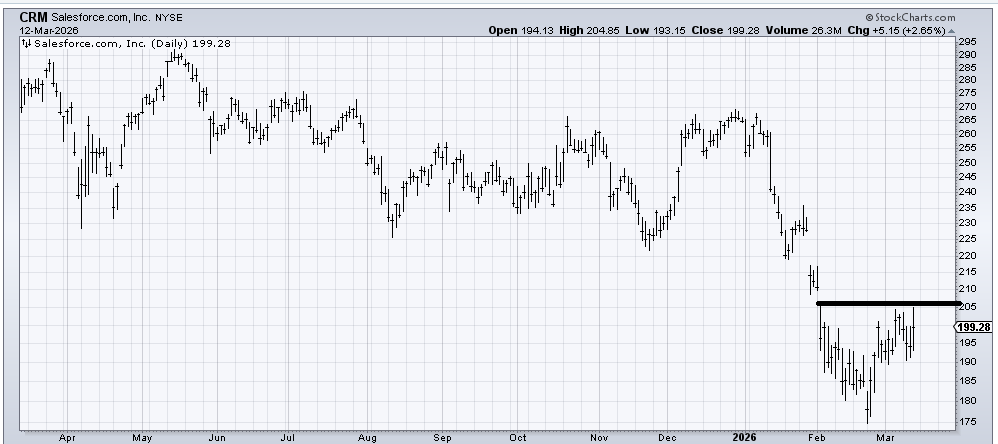
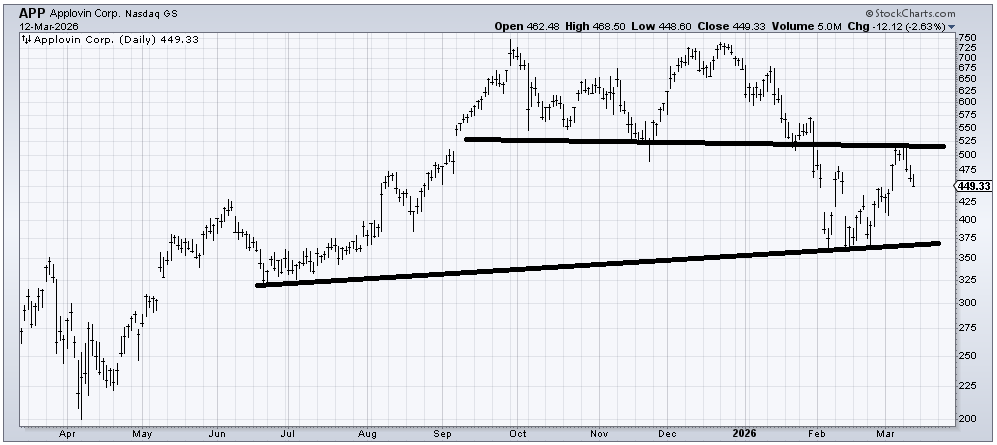
I just want to point out that my view on the software names has been and continues to be that the stocks will sort themselves out. They will begin to have different patterns. Some will bottom; some will see the bottom fall out. Just notice how Salesforce.com (CRM) looks compared to Applovin (APP) . There ought to be a long period of back and forth in these names.
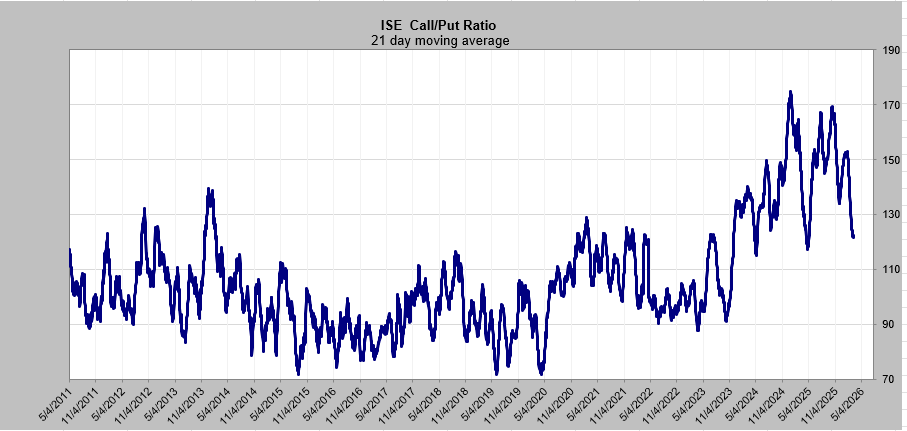
Today’s Indicator
The ISE call/put ratio’s 21 DMA is now at 1.21. That April 2025 low was 1.17. Panic would show us a reading under 1.0, which we haven’t seen yet, but the persistent hedging is definitely present.
Q&A/Reader’s Feedback
Helene welcomes your questions about Top Stocks and her charting strategy and techniques. Please send an email directly to Helene with your questions. However, please remember that TheStreet.com Top Stocks is not intended to provide personalized investment advice. Email Helene here.
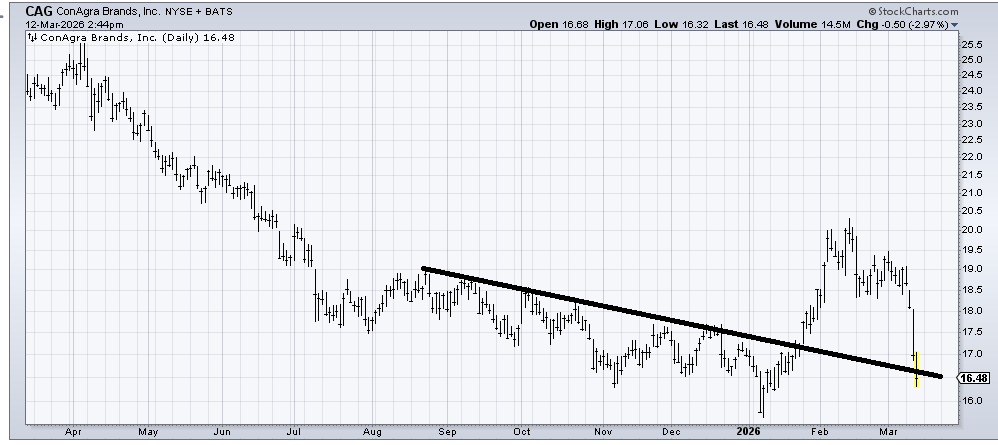
I don’t love that ConAgra (CAG) has come all the way back down without even taking a breather at support. There is support here, and it has been down quite hard three straight days. It ought to bounce, but it’s hard for me to think this is okay.
I was asked for the measured target on (XLF) now that it broke down. It is around the mid 40s (44-46). The selling has been pretty relentless, so I’m not sure if it can be a waterfall decline. It is also a little short-term oversold. I still don’t like the financials or banks.
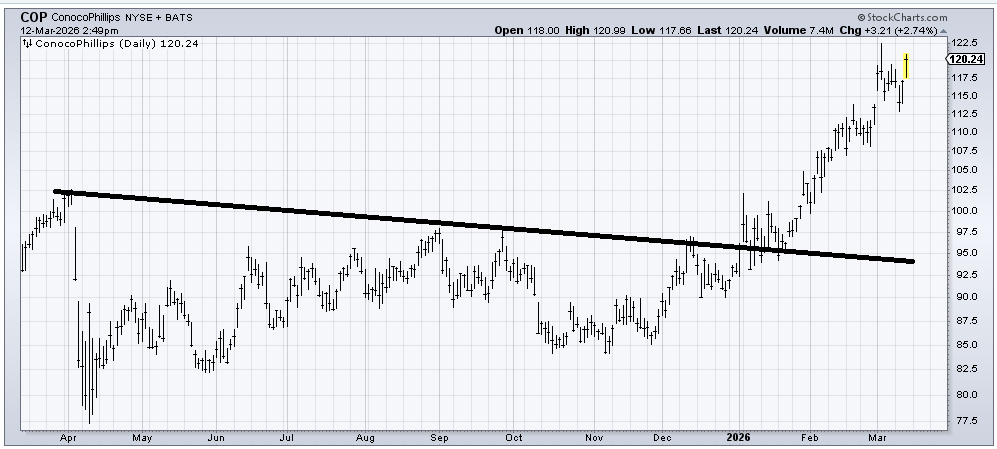
ConocoPhillips (COP) has a measured target in the 120-125 area, which is where it basically is. Maybe it takes out that spike high from two weeks ago, but it seems to me this is the area you would want to take a few profits in.
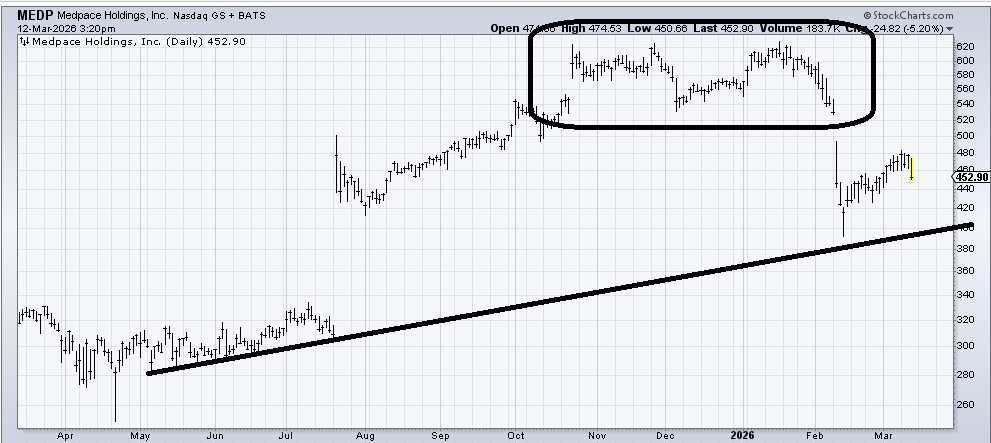
Medpace (MEDP) has a sort of island top (circle). A trip down to that line around 400 would be a retest of the spike low and the line. If it doesn’t hold, then filling that gap down around 330 would be in play next.
Related: Why I'm Stalking a Large-Cap Tech Stock in This Ugly Market
