Let's Step Back and Take a Close Look at the S&P, Nasdaq and Russell
After the latest pullback, one the three indexes is the most interesting to me. Plus, two positives and two sour points in Thursday's statistics, Nvidia, Amazon, Rocket Lab and more.
You've reached your free article limit
You've read 0 of 1 free Pro articles.
The Market
I expected some pullback but not that much. Yet let’s do something different today and step back and look at the charts of the Nasdaq, the S&P 500 and the Russell 2000 IWM.
The S&P, weird as this may seem, has spent the last week or so trading back and forth in a wide range — very wide. On April 4, last Friday, it closed at 5074 and as of Thursday it stands at 5268. Yes, it’s up on the week but step back and doesn’t the last week look like a choppy sideways pattern?
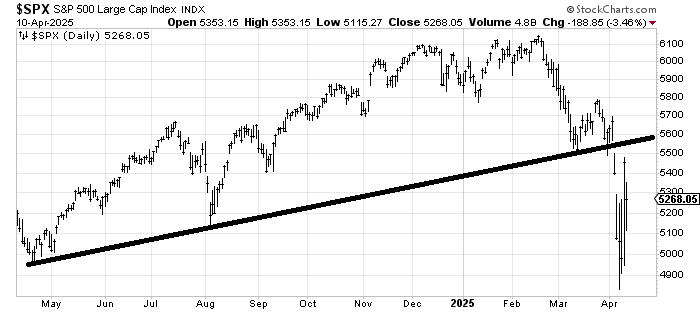
What is important is that we broke that long-standing uptrend line. And any rally ought to struggle to get back over it. Wednesday night I noted the resistance at 5500 but also at 5700. The chart itself looks terrible, but the point is that there is now a lot of resistance overhead.
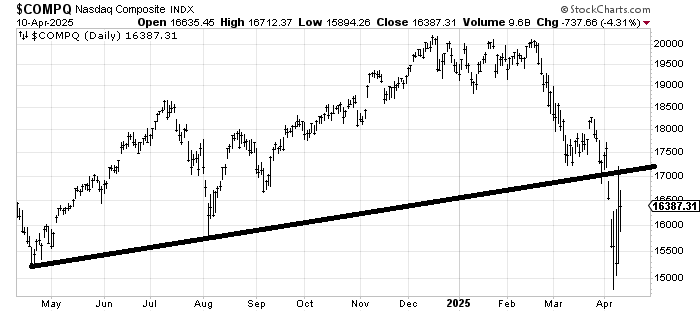
The chart of the Nasdaq is similar. It too is up on the week and actually appears to have a more upward bias over the last week than the S&P. But again, all that resistance at 17000-17500 is a lot.
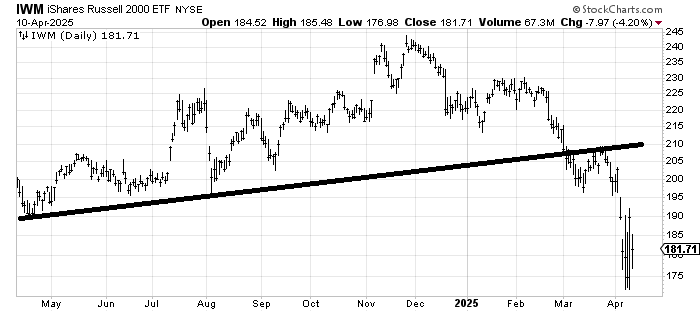
The IWM is the most interesting to me. Only because my perception was that it acts worse than the big-cap indexes (it does). Yet it too is trading exactly where it closed last Friday. So, sure, the others are up on the week, but IWM is not down.
I share these with you because Wednesday night I noted that there has been so much damage to the charts that there will be a long time to repair them ahead. So despite the sideways-ness of the last week, there is an awful lot of work to be done.
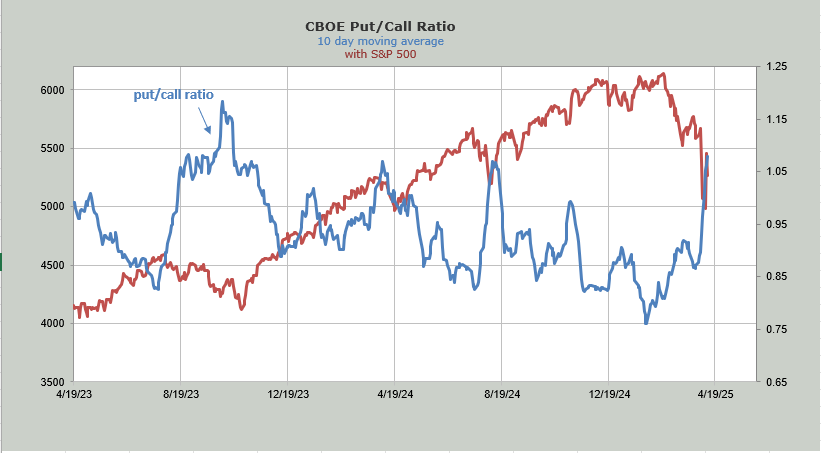
As for Thursday’s statistics, there was the usual that breadth was poor and the put/call ratio was high. In fact, the 10-day moving average of the put/call ratio is now at 1.07, where it was in August. Notice though that it was 1.18 in the fall of 2023. So the options folks were more cautious, or at least were hedging more in the fall of 2023.
However, I view the put/call ratio overall as a positive for the market. There is one other positive from Thursday’s options action: The put/call ratio for the VIX was over 1.0. We consider the VIX options traders smart money so they are banking on a lower VIX now. Let’s see if they get persistent.
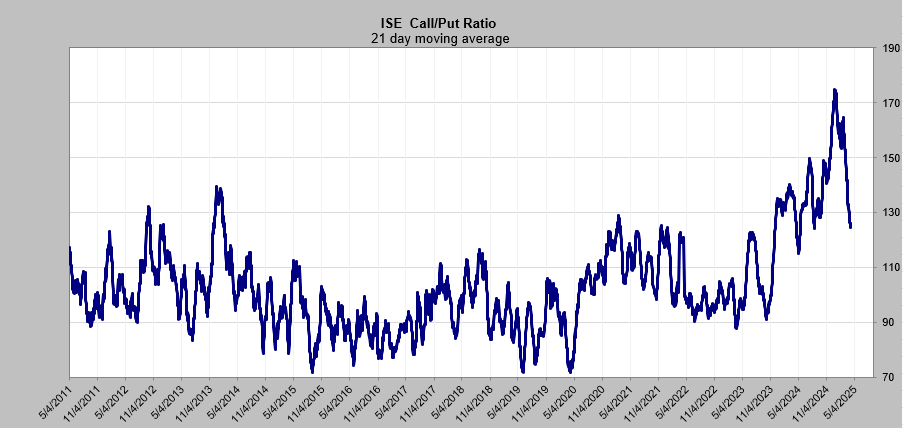
The ISE call/put ratio is another story. Recall this is mostly small options traders and it is not even close to a low. Typically, by now we would see it collapse under 1.0. We have had a mere two readings under 1.0. That’s it. The 21-day moving average is still high in my view.
A sour spot in Thursday’s action was the SOX relative to the Nasdaq as it ticked down, although it has not made a lower low.
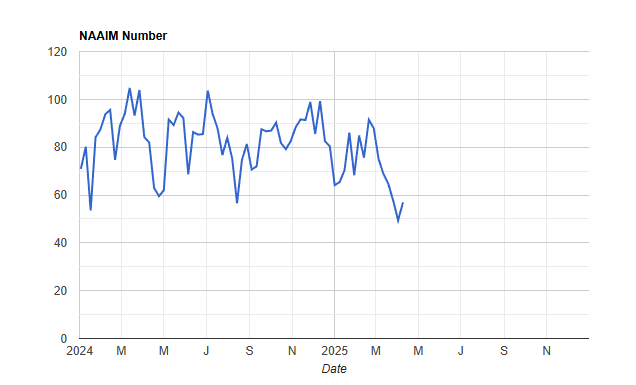
Another sour spot was the NAAIM Exposure. These folks are like the small options traders, they refuse to give up. This is shocking to me as typically by now they would have reduced their exposure. But they lifted it. This should be in the 30s by now.
I would not change my view from Wednesday night in that I still think we have another rally attempt but this is a trading market and we ought to come back down once this oversold condition is worked off.
New Ideas
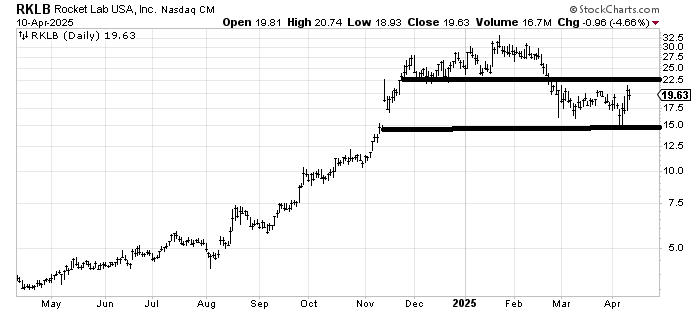
Rocket Lab USA RKLB is not the sort of stock you expect to hold up and rally well in this type of market. But someone had inquired about it about a month ago so I thought I would follow up and note all that resistance at $22 — if it can get there.
Today’s Indicator
The put/call ratio and the call/put ratio are discussed above with charts.
Q&A/Reader’s Feedback
Helene welcomes your questions about Top Stocks and her charting strategy and techniques. Please send an email directly to Helene with your questions. However, please remember that TheStreet.com Top Stocks is not intended to provide personalized investment advice. Email Helene here.
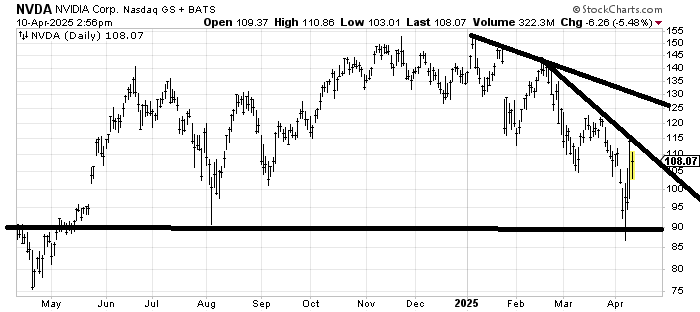
Nvidia NVDA looks like a top to me, although it is possible that a month or so from now when that trading from last May falls off the chart it won’t look as bad unless I go to a longer-term chart. Be that as it may, the current resistance is around $115-120.
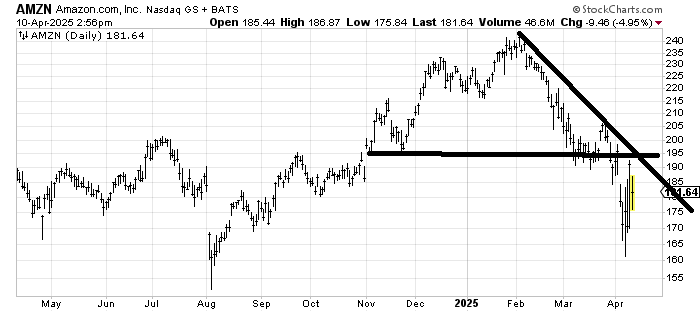
Amazon AMZN has resistance in the $190-195 area. I’m actually surprised it has not yet made it down to the August low.
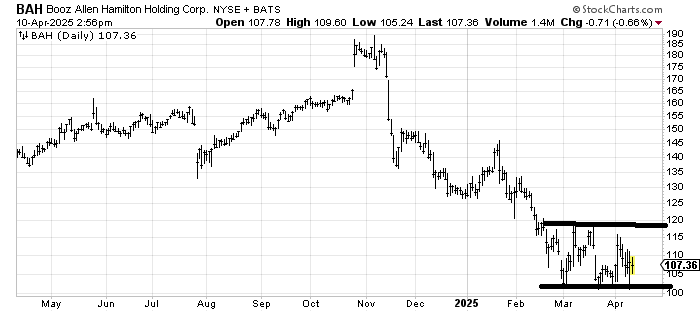
It’s actually quite impressive that Booz Allen BAH has held $100 for the last six to eight weeks. Maybe it is trying to build a base. For now we’ll call it range bounce between $100 and $120. If it breaks $100 I’d sell. If it gets over $120 its next resistance is $125 so it’s not exactly a breakout, more like a change.