Last Week's Churn Took the Momentum Out of the Market
A look at the sentiment and momentum indicators gives us an idea of what could happen for the rest of May.
You've reached your free article limit
You've read 0 of 1 free Pro articles.
The Market
As long-time readers know, I spend a lot of time focused on sentiment. Recall when this rally first started, I said, as I always do, we’ll see how fast folks turn bullish. That’s because I generally believe that once everyone is ‘all in’ or ‘all out’ (panic), there are better opportunities to have a turn in the market.
That’s why I have noted the ten-day moving average of the put/call ratio slipping under 0.85. It’s why I noted the big shift in exposure from the NAAIM folks. I also realize that most folks –and I cannot fathom why!!!—seem to think the AAII is a great survey. Let me remind you that these folks saw the bears crank up over 60% in late February, but we did not make a low until early April, so it’s hard for me to get on board with this indicator. I do, however, think it is useful when other indicators confirm it. Which is what happened in early April.
Friday’s put/call ratio came down to 0.77, which is the lowest we have seen since late March, just before that final tumble. So why is it I still believe that, should we get some more downside this coming week, we will rally again?
Because sentiment getting bullish does not stand alone. I also need to see the indicators stall out and roll over. We have seen the Nasdaq Hi-Lo Indicator turn south. The NYSE has not yet done so. That’s one reason I have been focusing on the new highs made on the NYSE. It’s not great, but it improved modestly last week on Thursday. Friday saw it retreat again, which is why one day does not make a market, and the indicator, which will only turn when there are several days that show a change, is important to watch. The chart is shown below.
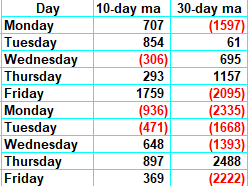
You may have noticed that the majority of stocks did a lot of churning last week. The indexes were mostly flat to down a smidge for the week as well. That’s the short-term overbought condition taking the momentum out of the market. My short-term Overbought/Oversold Oscillator is far from oversold, and when we look at the numbers we are dropping off the moving average (10-day MA) we don’t see much red, meaning it is not oversold. But I ask you to look at the more intermediate-term 30-day MA column. Do you see all that red –and big red numbers—that we drop starting Friday? That is why I think we are not yet overbought on an intermediate-term basis.
Once we finish dropping those big red numbers, we will be intermediate-term overbought. All those big red numbers are set to drop the week before Memorial Day.
It is possible if the market falls a lot this coming week and we rally again, yet we will not surpass 5700 on the S&P? It is possible. That is not what I am focused on just now; rather, I am focused on the indicators. Will they be rolling over by the time that week arrives? Will other sentiment indicators like the AAII survey and the Investors Intelligence survey show a big shift in sentiment?
This coming week looks like more chop to me, but it is that week leading up to Memorial Day that ought to give us the clues.
New Ideas
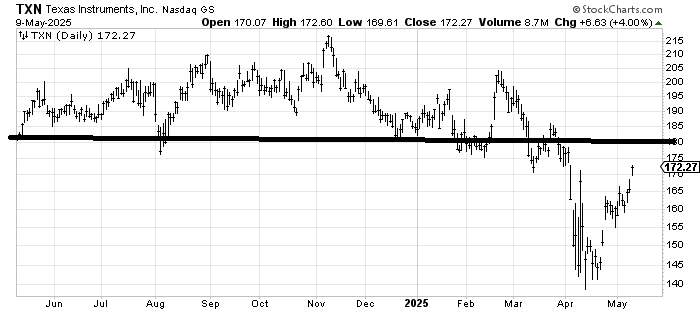
Last week, we looked at Texas Instruments TXN as an example of a stock that had been churning since earnings, and I asked, can it get through and make a higher high? It did just that on Friday. I still don’t think there is a base to speak of, but I applaud the move all the same. Resistance gets pretty heavy at 180.
But look at the chart again and see what I am talking about above: churning and rallying again ought to be the pattern we get in the market. Will TXN be at resistance when we get intermediate-term overbought?
Today’s Indicator
The Hi-Lo Indicator is discussed above.
Q&A/Reader’s Feedback
Helene welcomes your questions about Top Stocks and her charting strategy and techniques. Please send an email directly to Helene with your questions. However, please remember that TheStreet.com Top Stocks is not intended to provide personalized investment advice. Email Helene here.
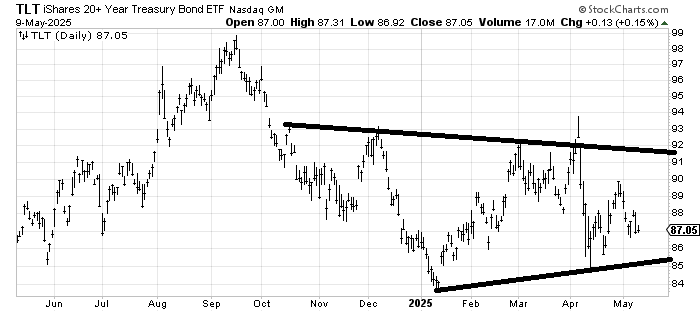
I had high hopes that TLT was in a wide trading range, but last week has given me pause on that. TLT has been down quite a bit since the calendar turned to May. I would not get quite concerned should we see it break under 85.
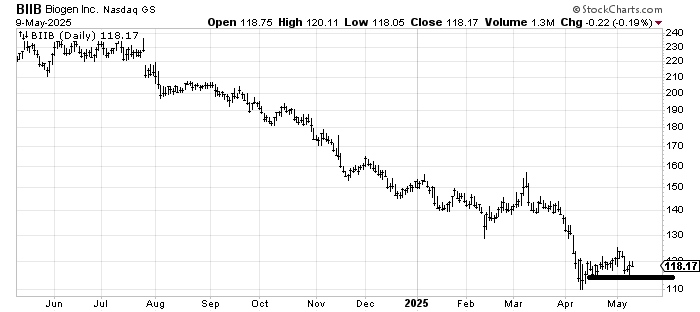
I was asked to follow up on Biogen BIIB, which came down to 115, and is trying to rally again. I would use a stop under 115. There was no base there to start with, just a chance the stock could/should rally to resistance at 130.
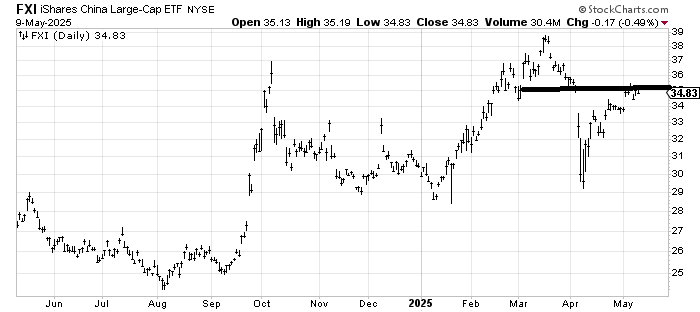
A follow-up on FXI shows it did, in fact, fill the gap, but it hasn’t backed off much from it. A pullback into that gap at 34 probably produces another rally into resistance, but I still think there is a lot of resistance up there, so I don’t want to chase it over 35.