Killing Palantir Price Target As Stock Faces 'Death Cross'
The AI wrecking ball has taken a toll on the firm's stock.
You've reached your free article limit
You've read 0 of 1 free Pro articles.
Readers will recall that, about two weeks ago, in discussing Palantir Technologies (PLTR) , I displayed what I saw as a basing period of consolidation that was suffering downside pressure. The downside pivot for the pattern was $146, which was triggered. At the time, I saw the "add level" as being around $132. That has not worked.
While Palantir is a case study on the fact that investors need to have target prices and panic points and then take action on both, we know that both the firm's earnings and fundamentals were strong. In fact, extremely strong. Palantir has the strongest balance sheet I know of and I look at balance sheets more often than does the next guy. Trust me on that. So where do we start building back our long position in Palantir? Tough question.
Charts
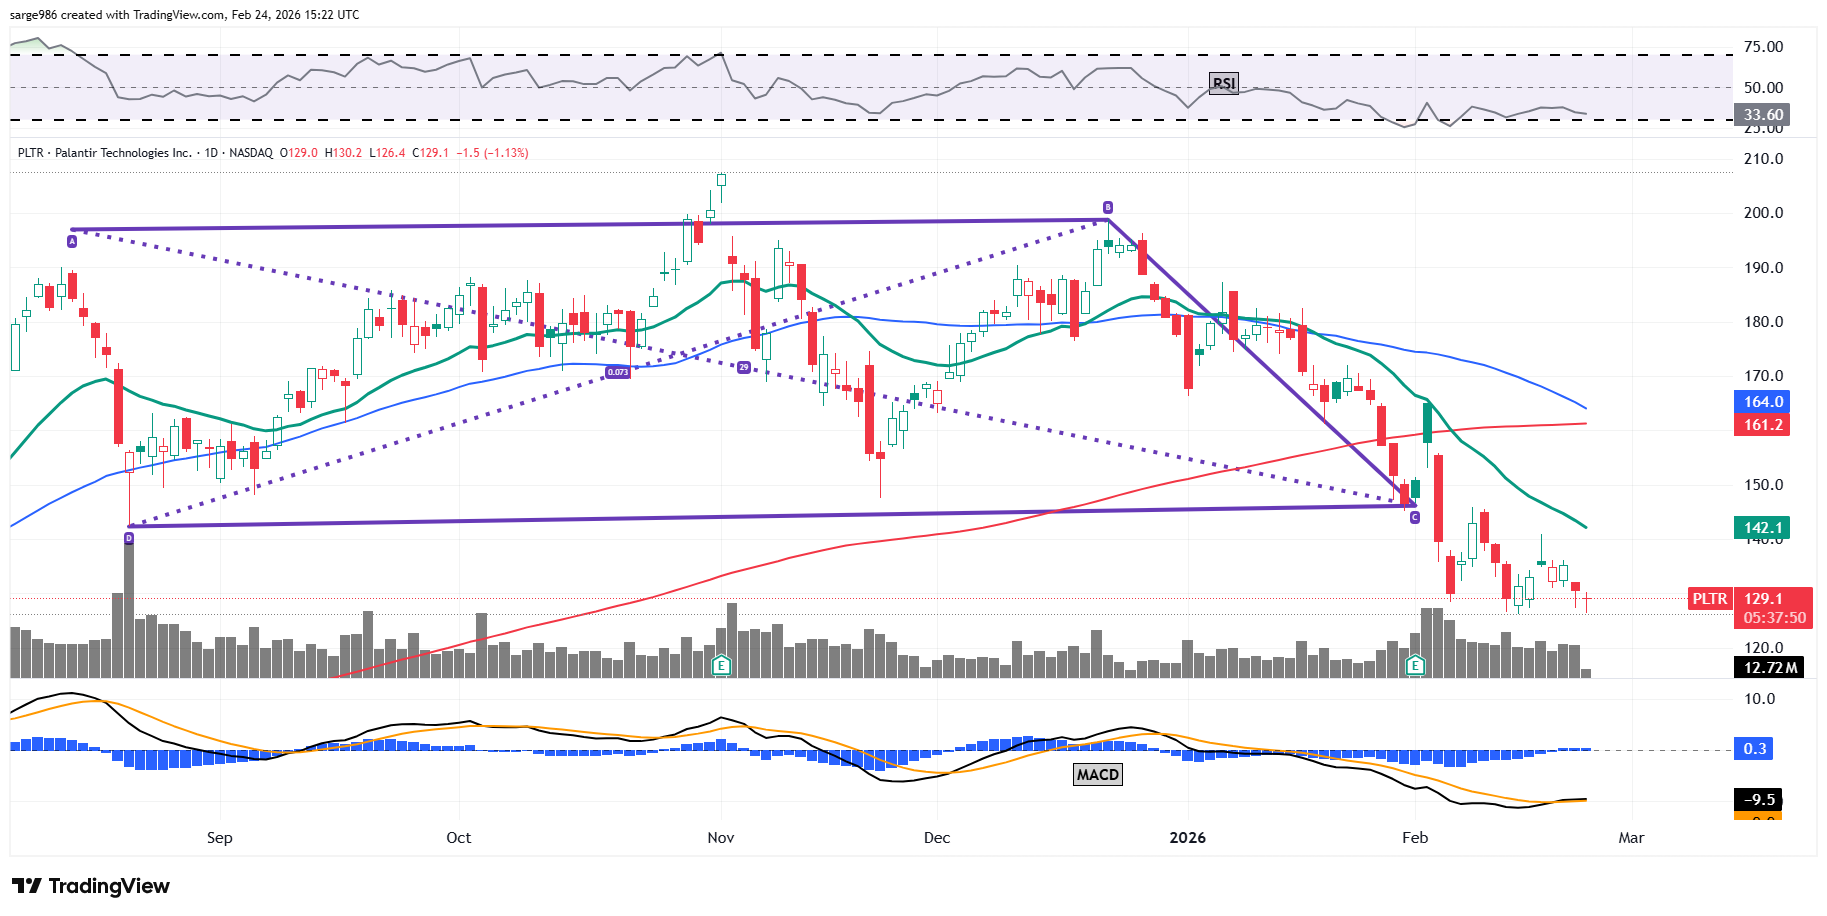
Here's the flat base that I had drawn up for you a couple of weeks ago. Now, take a look at this:
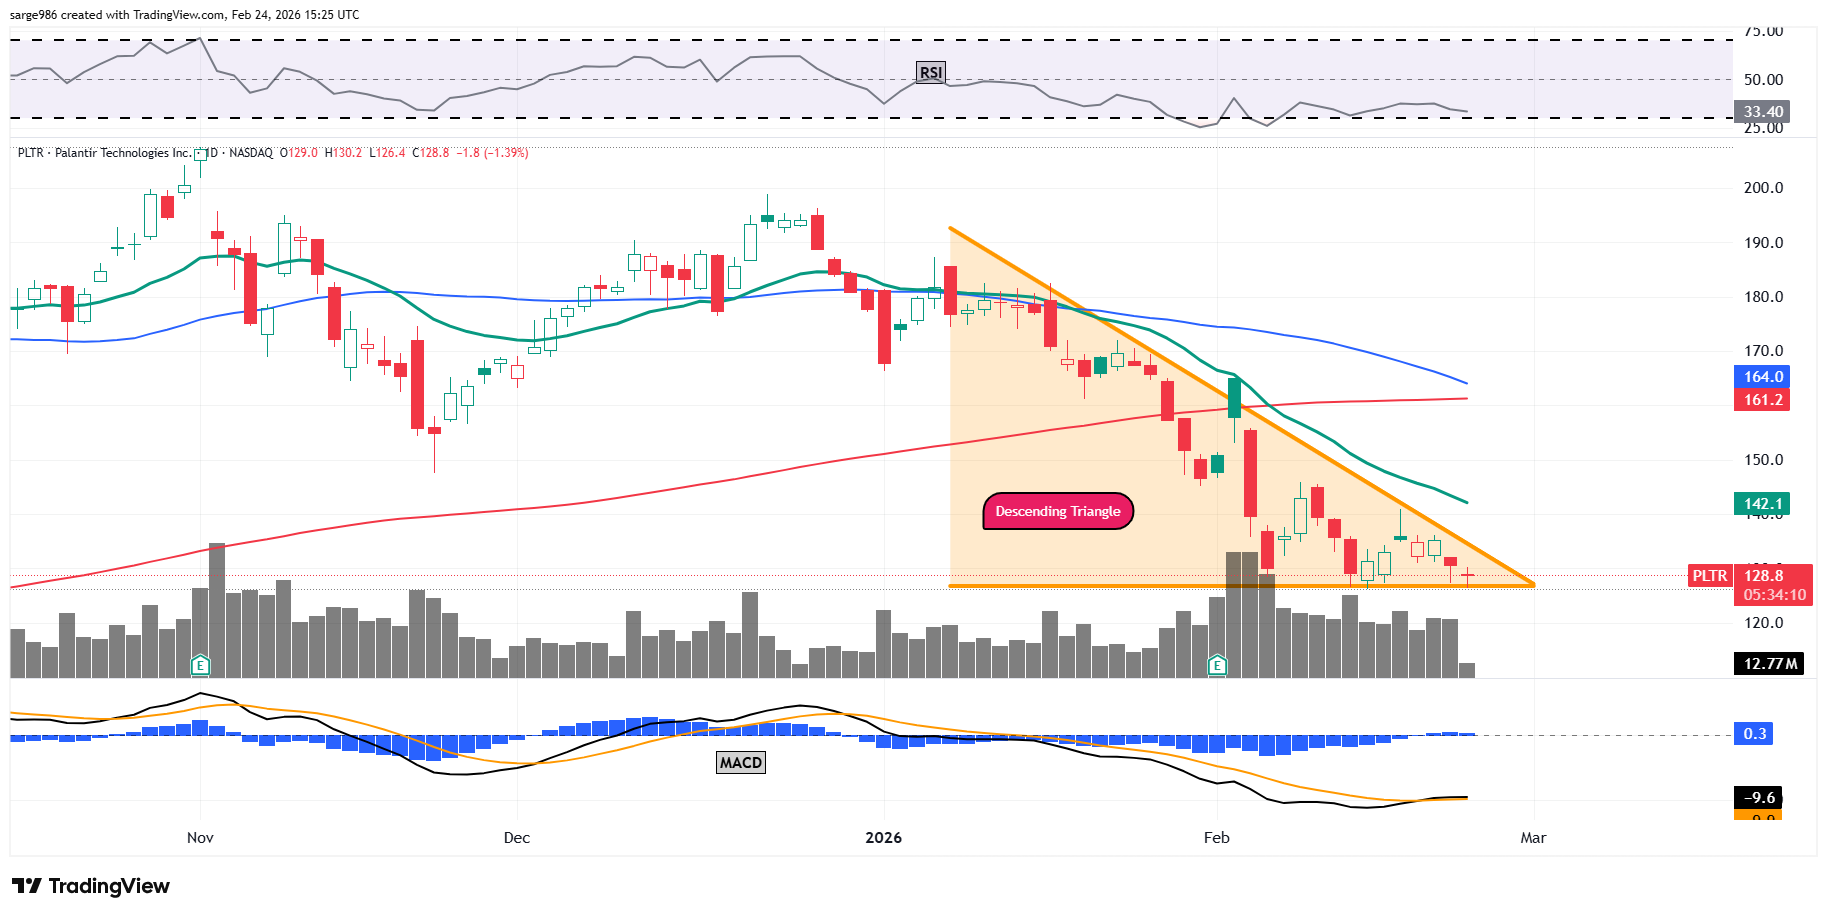
Readers will see a descending-triangle pattern of bearish continuance with a $126 pivot. That's not an encouraging sign to see at this point. The shares are still trading below all of their key moving averages. In addition, the 50-day SMA is closing in on the 200-day SMA from above. That would be the infamous "death cross" if it were to occur.
Remember, though, that a death cross bears much more weight if the 200-day line is in decline when crossed. Here, that line is still rising, for now. The triangle presents a technical case for prices as low as $115.
Is Anything Looking Bullish?
I did tell you that I would have to cancel my $217 target price once a bullish pattern appeared lower. Well, we still do not have a bullish pattern to gawk at, but please consider that target cancelled. The indicators are not looking all that sharp, but there is some positivity. Relative strength is relatively weak. That has not changed.
That said, below the chart, there is some mild positivity within the daily MACD, which is still not strong. For one, the histogram of the nine-day EMA has moved above the zero-bound. Secondly, the 12-day EMA is running in line with the 26-day EMA and appears to be making an attempt to get the upper hand there. These would be short- to medium-term bullish developments.
There is no upside pivot south of the 200-day SMA right now at $161. That will have to be my makeshift target for now and when it gets there, we'll provide a higher level for you.
The thing the bulls need to see right now is for that lower support line on the triangle pattern to hold. Failure of the triangle to result in trend continuance could be the shot in the arm that the stock needs. That's just a lot to ask. At the moment, I do not add above $115 or below the 21-day EMA at $142.
At the time of publication, Guilfoyle was long PLTR.
