Kicking 2026 Off With Nasdaq Losses. Does This Indicate a Shift in Trend?
Or is it just the fault of thin trading following the holiday? Let's look at the charts.
You've reached your free article limit
You've read 0 of 1 free Pro articles.
The Market
The S&P is basically flat since I last wrote this newsletter. Well, okay, it is down fifty points. One would think that’s a whole-lotta-nothing, and mostly it was until Friday.
Was Friday’s move up in the 493 a big change, or was it just a thin trading day on the first day of the new year?
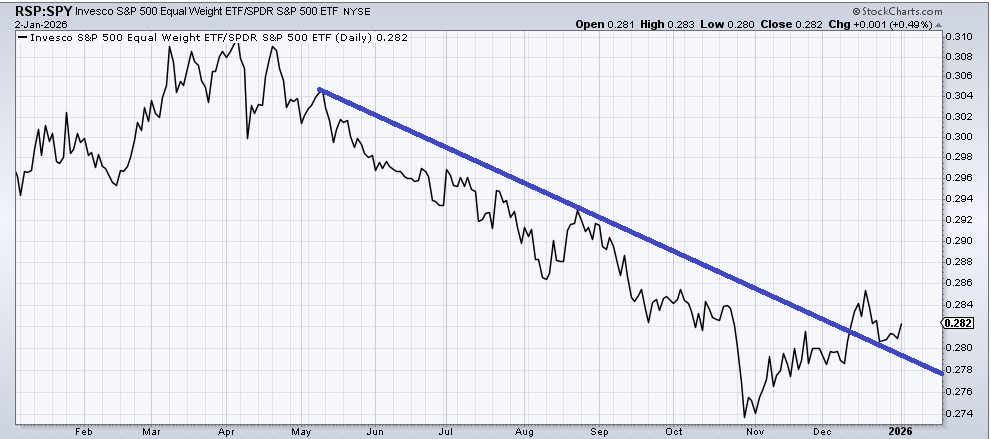
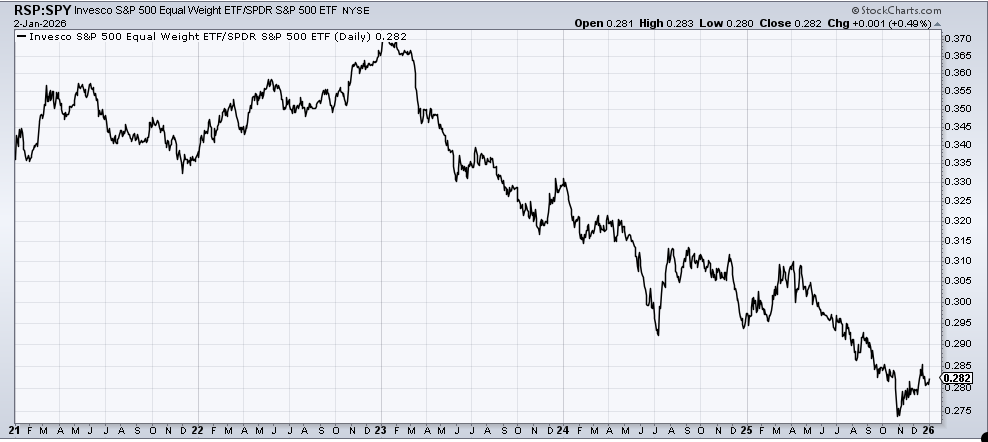
Everyone continues to watch the ratio of the RSP (equal weight) relative to the S&P (market cap weight). We’ve looked at this chart before, and as a pure chart, crossing that downtrend line and retesting it is a big positive. The relationship has been in a downtrend since last spring, so crossing the line represents a change in the relationship. After that, it’s hard to garner much. So, let’s just say that on balance, this ought to be a positive for the 493/RSP.
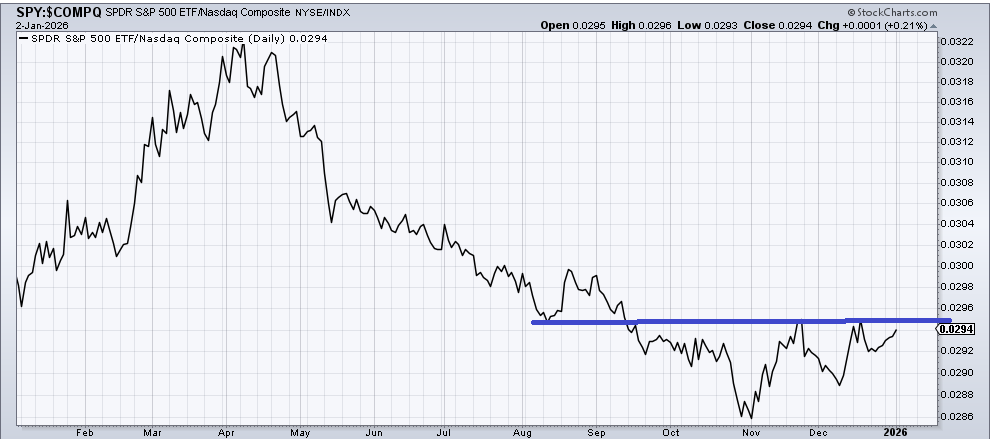
However, I am more interested in the ratio of the S&P to Nasdaq. Similar to the RSP/SPY ratio, it has been in a downtrend since last spring, but unlike that ratio, there is quite a flat line I can draw that is just overhead.
Let’s look at the longer-term chart of this particular ratio. We can see how tiny this little base is on a five-year chart, but take a look at last February (green arrow). That was well before tariffs were announced. The tiny little breakout over the blue line arrived in March (again, before tariffs were announced).
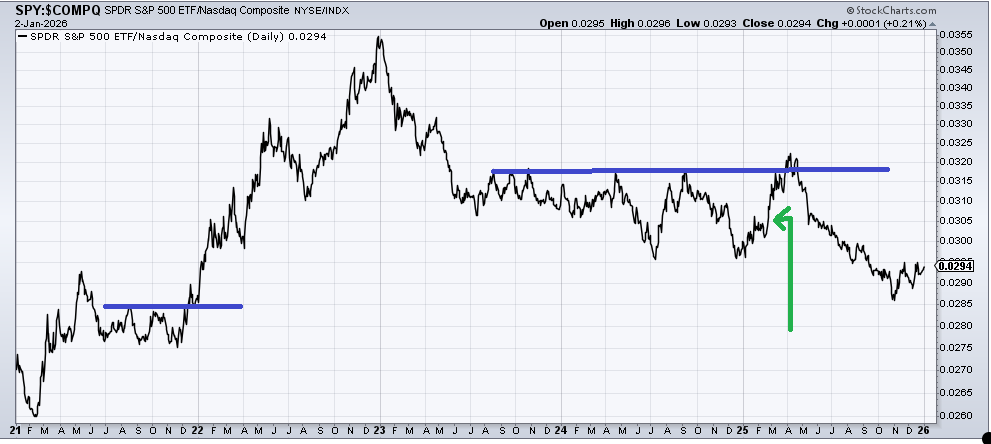
On the far left side of the chart, long-time readers might recall I fussed over this relationship as we entered 2022, drawing in that same line. Again, this time is much smaller than either of those other two, but the results tend to be the same: when the S&P is outperforming Nasdaq, the tech-heavy index tends to be in trouble.
If you are wondering about the longer-term equal weight to cap weight ratio, that’s just a long-term downtrend with the exception of the minor ‘breakout’ in 2022. So I would keep my eye on the S&P relative to Nasdaq for signs of a shift that has some legs.
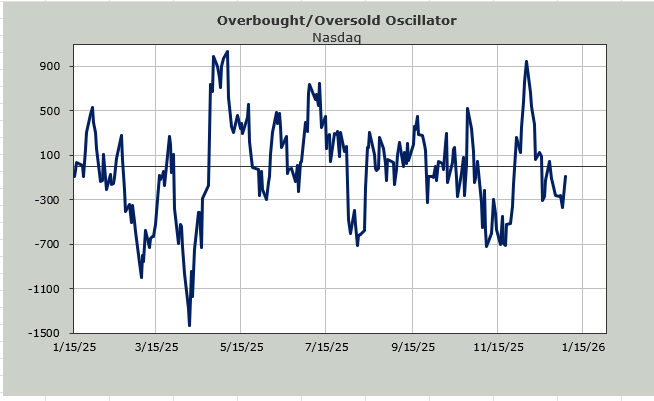
Now, in the very short-term, Nasdaq has been red for five straight days, something it hasn’t done in a year. That too is a shift, but it also means Nasdaq will get short-term oversold in a matter of days.
And if you thought the fact that both the S&P and Nasdaq were down in the month of December (first down month after seven straight up months) would get sentiment to shift, you would be incorrect. Sentiment remains complacent.
New Ideas
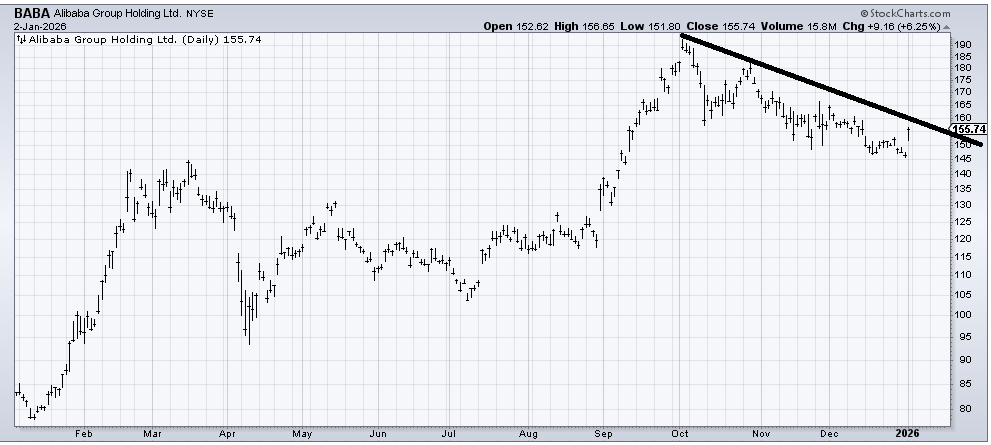
I want to follow up on Alibaba (BABA) , which I have liked for about a month, and it has done nothing but drip lower—until Friday. But it still has not crossed that downtrend line, nor has it lifted itself up and over that 160-165 area. I think it will do it, but until it does, I’m going to use a stop under 145 now.
My other Chinese technology pick, Baidu (BIDU) , has done much better, but BABA needs to join the party.
Today’s Indicator
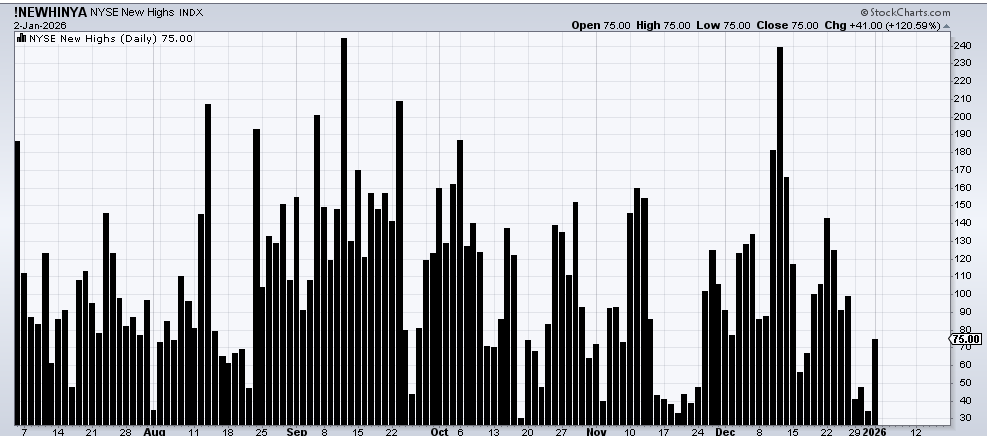
The new highs are still terrible. New lows aren’t great either. It’s been that way for months, though.
Q&A/Reader’s Feedback
Helene welcomes your questions about Top Stocks and her charting strategy and techniques. Please send an email directly to Helene with your questions. However, please remember that TheStreet.com Top Stocks is not intended to provide personalized investment advice. Email Helene here.
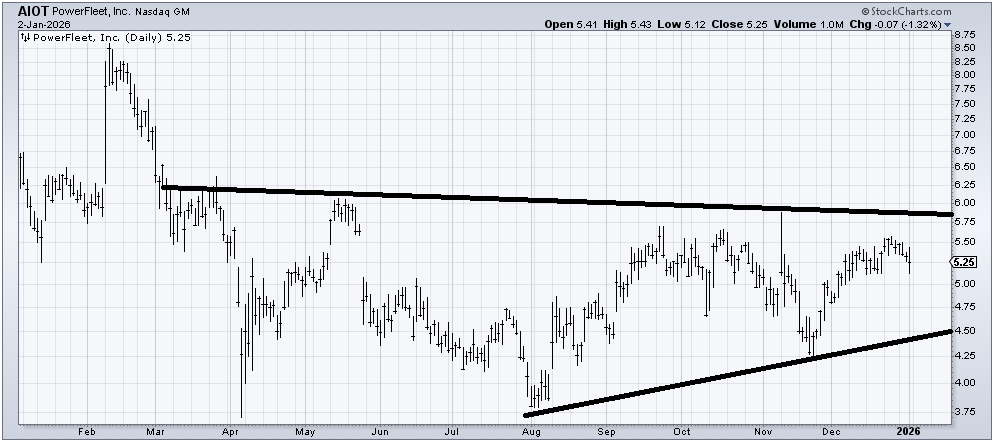
PowerFleet (AIOT) is working on a base, but it feels a bit early, as if it needs one more swing into that 4.50-4.75 area, or some sideways action for a few weeks. I’m inclined to like the chart longer term, but what I don’t like is that all the up moves are seemingly met with selling. Get this over 6, and that would be good. For now, I’d wait and watch for signs the selling has dried up.
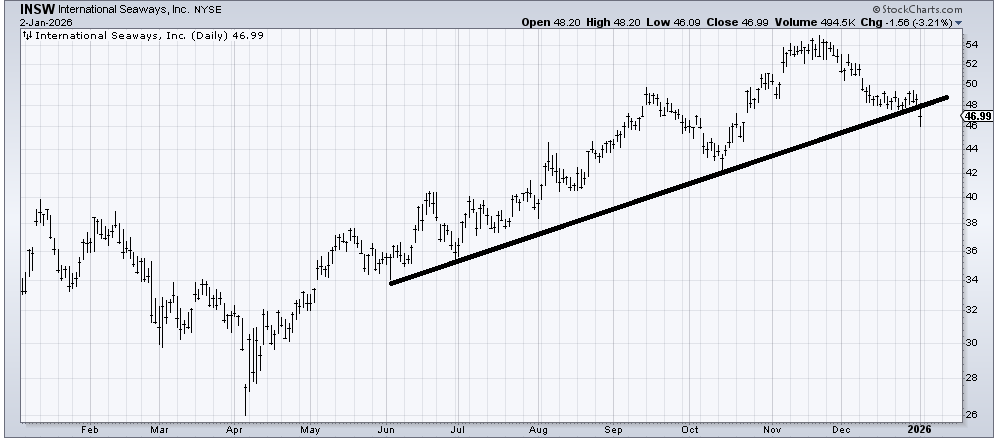
The good news for International Seaways (INSW) is that it filled that gap from October and therefore should bounce. The bad news is that if it can’t get back up over 48 on a bounce, it’s bearish with a target near 42-43.
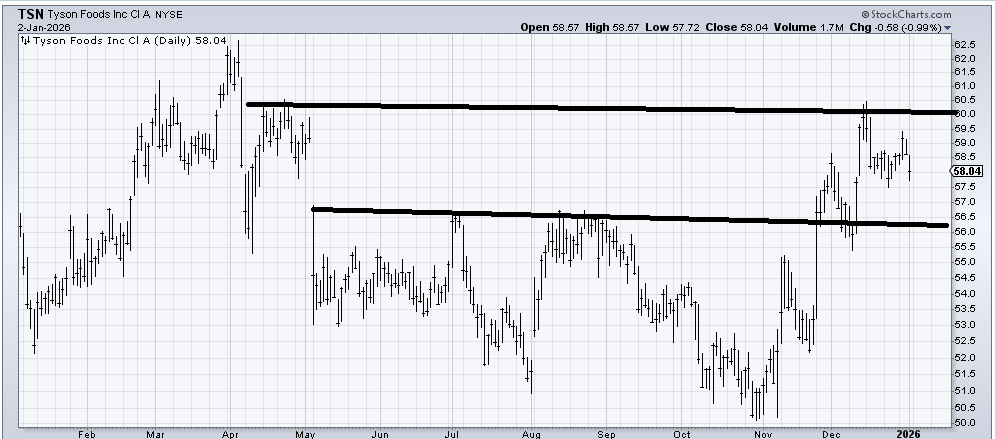
I’m inclined to think Tyson (TSN) will be stuck in a trading range (between 55-60) for a while as it attempts to eat through that resistance from last spring. I’d like to see how it acts at that 55 area; if it shows signs of holding well down there, I’d be a buyer.
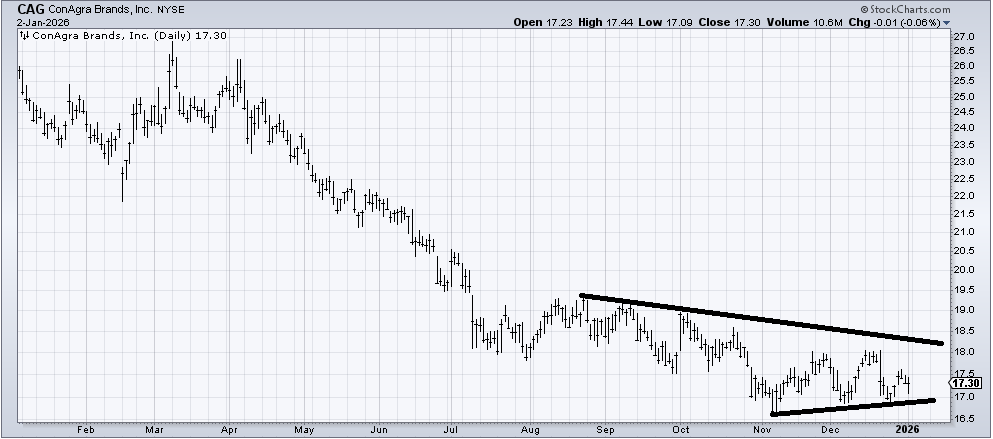
The fact that ConAgra (CAG) yields 8% has me desperately trying to find a reason to buy it. There is no base to speak of; it keeps making lower trading ranges, too. So, let’s say it’s a bottom fish with a stop under 16.50 (because that would indicate another lower trading range).
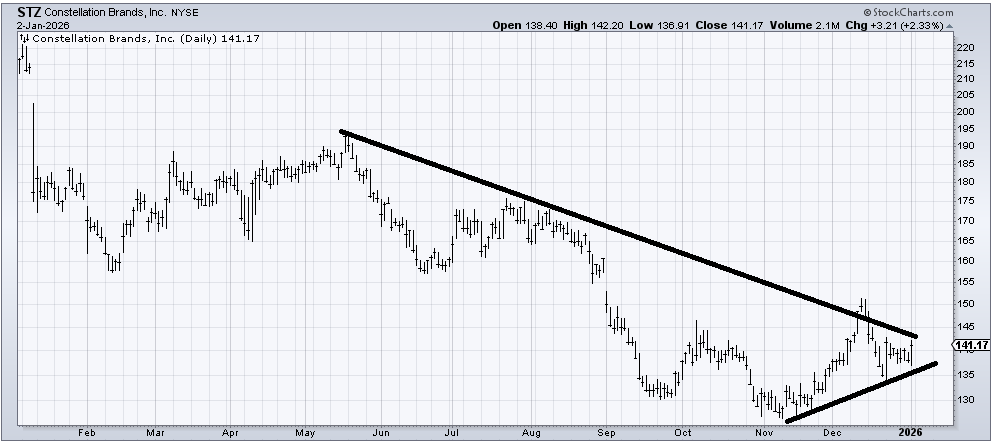
Constellation Brands (STZ) is trying to form a base (even though no one drinks anymore!). I’d be a buyer for a trade with a stop under 135.
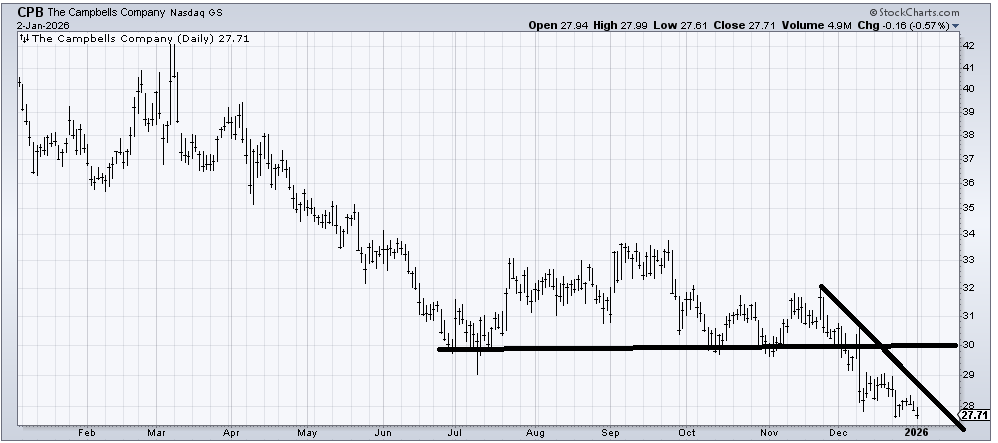
Campbell’s Soup (CPB) shows no signs of holding, so for the time being, the best I can say is it is oversold, but I do not think even if it rallies, it can get over 30.
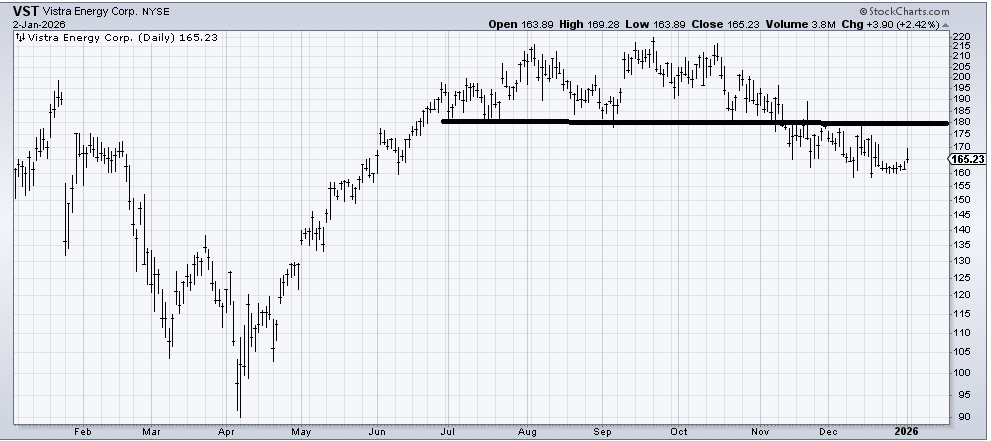
If Vistra Energy (VST) can rally to 175-180, I’d sell some up there.
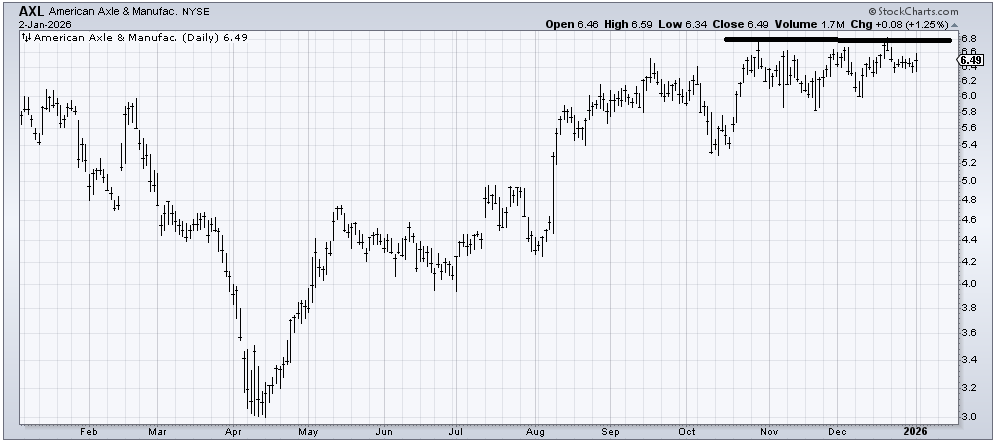
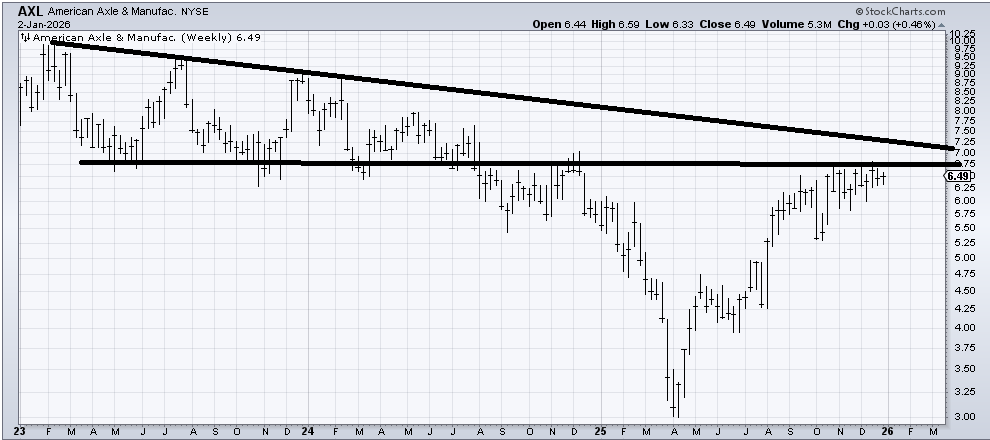
When I see a daily chart like American Axle (AXL) , that is pushing up against resistance at the top of the page, I like to look at the weekly chart to see if it shows something more. Lo and behold, when we look at the weekly chart, we can see a ton of resistance over that 6.75-7 area. For the time being, I think the lid on this chart is in that area. It’s possible a trip down into that 5-ish area over time would help the chart build a better base, but right now, I just see a lot of resistance not far overhead.
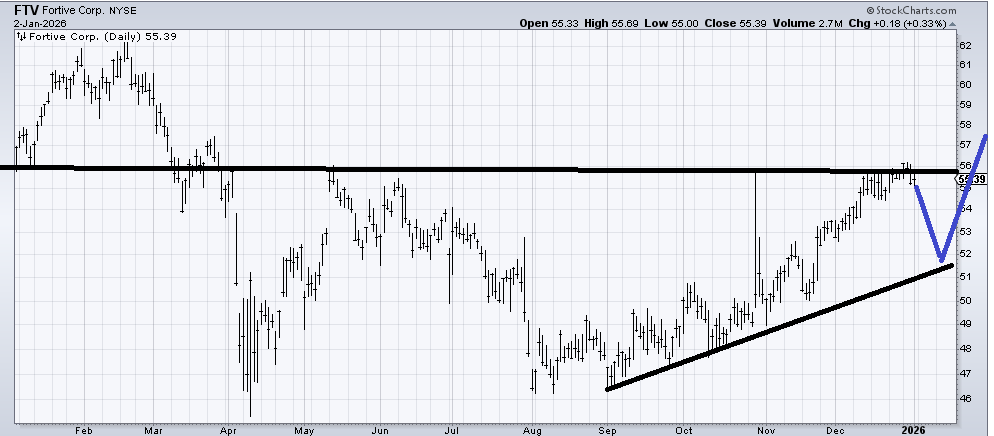
This mid-50s area on Fortive (FTV) has been a tough spot. I stare at the chart and think a right shoulder would make this chart pretty. Some type of action, as I have drawn in blue, would make this a nice-looking base. Focus on the pattern more than the price (i.e. a dip followed by a rebound)
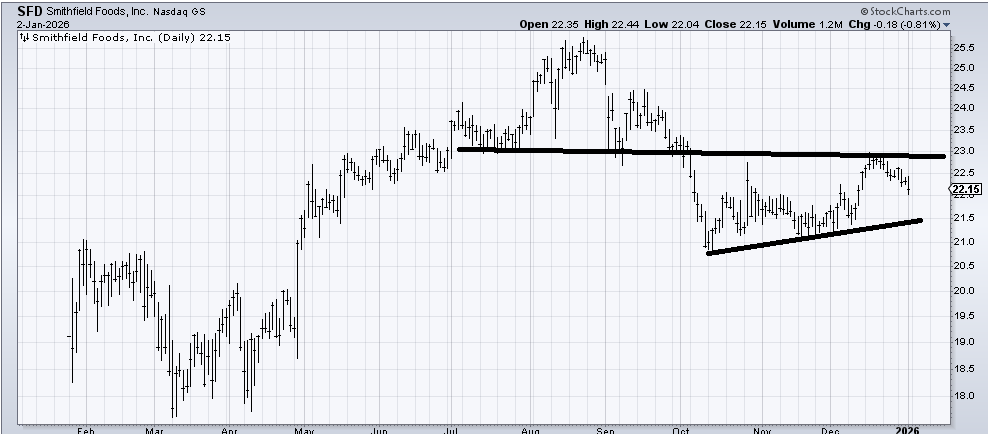
Smithfield Foods (SFD) ran smack into resistance at 23, so if it rallies again, I would expect that 23-24 area to struggle again. What I am trying to decide is if it will hold that 21 area on this trip back down. If it can hold, maybe the chart improves, but mostly it looks like the best it can do is go sideways for now.