Key Ratios Indicate: Speculators Might Be Feeling Comfortable Again
For the first time this week Nasdaq volume exceeded 10 billion shares.
You've reached your free article limit
You've read 0 of 1 free Pro articles.
The Market
Note: I am taking the remainder of the week off. The next edition of Top Stocks will be Sunday, Oct. 19.
Today was one big fat nothing for the most part. Some stocks reversed while others kept pace. And the VIX refuses to go down.
But I am interested in the fact that for the first time all week, Nasdaq’s volume went back over 10 billion shares. You might recall that on Monday we saw what I would consider a dropoff in volume when it dipped to the lowest volume of the month. I wondered whether it was speculation-related or perhaps due to the bank holiday.
But it did not pick up much on Tuesday, when it remained under 10 billion shares. Then today it jumped to 11.5 billion shares. I figured back to normal volume.
But then I saw the put/call ratio had sunk to .78. And the ISE equity call/put ratio was just shy of 2.93 (recall it tagged just over 3.0 on Oct. 8, two days before the whack on Friday). So maybe what today’s statistics tell us is that after three days the speculators are feeling comfortable again.
There are a few other things to point out. Breadth has been better (not great, just better) this week. And the number of stocks making new lows contracted once again. This is a change from the past few weeks.
While Nasdaq is flat on the month, maybe flat is the new "correction"!
Finally I should note that the speculative data I cited here last Thursday has not changed much. Oh, sure, maybe we saw the market plunge for a day on Friday, but generally speaking, the intermediate-term indicators have not changed. Please feel free to reread that edition of Top Stocks for more detail.
Now today we have more signs of speculation run amok. Volatility shares will issue 13 new ETFs. They are all FIVE times single-stock ETFs. The list has the usual suspects like NVDA, AMD, TSLA but also bitcoin and ether, etc.
There is no timing to how these absurdities will affect the market, but know that in late 2008 we saw a 3x XLF Short ETF issued. The market bottomed in March 2009.
New Ideas
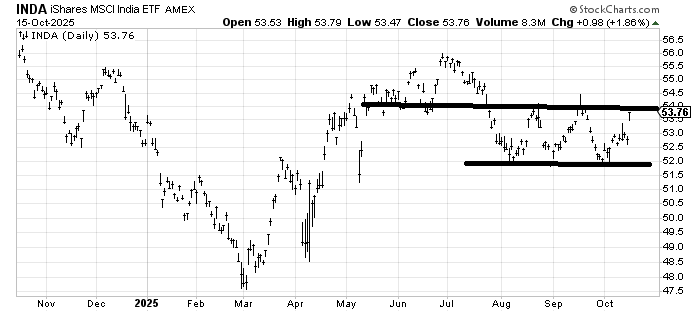
I want to follow up on (INDA) , an ETF to be long Indian stocks. I recommended it about two weeks ago at 52 and it has had a nice little run. It is now at some resistance but I still don’t see anyone chatting up India yet. I would prefer if it doesn’t retreat back under 52. And I’d love to see it up over 54.50.
Today’s Indicator
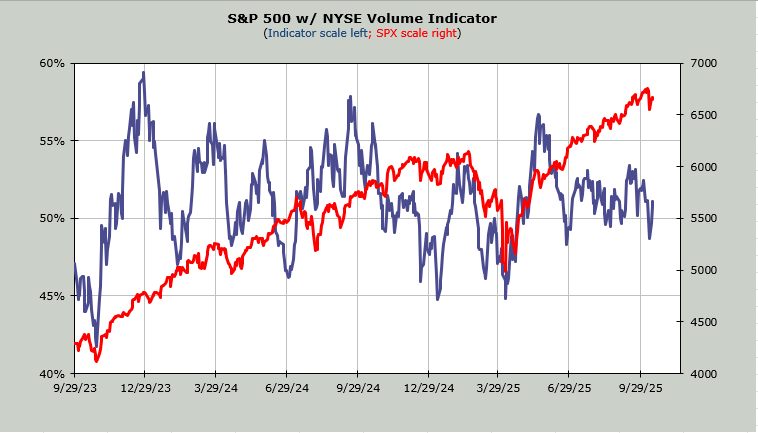
The Volume Indicator got to 49% after Friday’s action. But it is right back to 51%. It just refuses to budge!
Q&A/Reader’s Feedback
Helene welcomes your questions about Top Stocks and her charting strategy and techniques. Please send an email directly to Helene with your questions. However, please remember that TheStreet.com Top Stocks is not intended to provide personalized investment advice. Email Helene here.
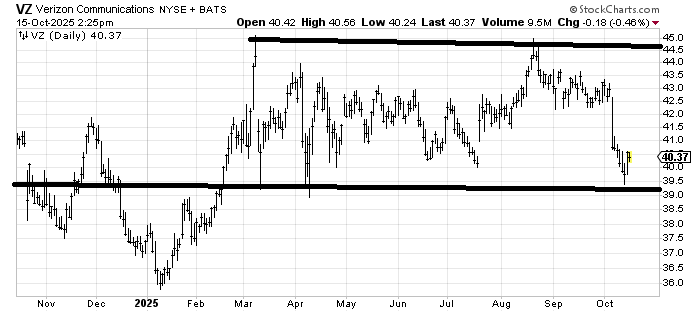
I do not like the plunge that Verizon (VZ) saw last week, but once again we have a stock that comes right down to the one-year line and gets saved from breaking through. If the stock does break under 39, it will be not only a change in character but also quite negative. For now I’ll call it a trading range (at best)
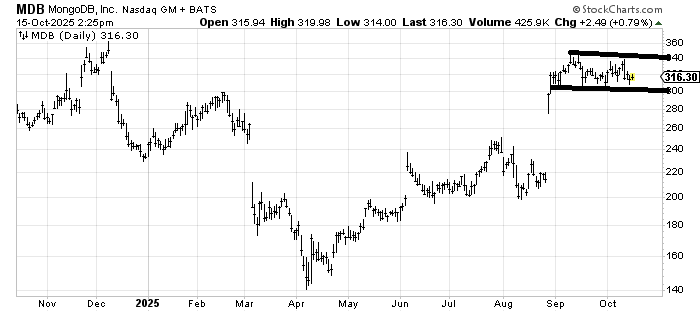
MongoDB (MDB) has left an island down below (action between March and August). But quite frankly it looks as if it ran the shorts in and there were few buyers behind it, as all it did was fill the gap from last December and sit there. If this breaks 300 I’d be careful.
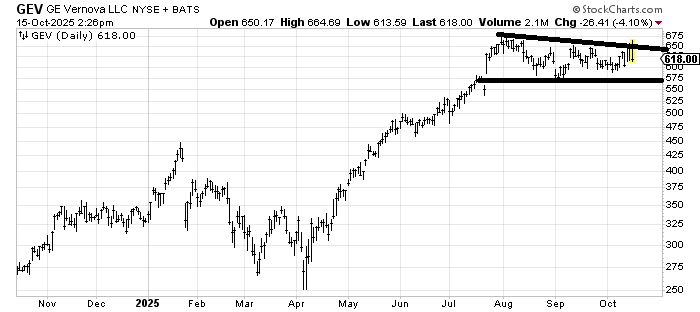
GE Vernova (GEV) is another former hot stock that peaked in the summer and has done very little since. It also hit its measured target when it got up there to 650. I’ll say this is okay as long as it doesn’t break 575. If it can ever crack over those highs, it measures about another hundred bucks.
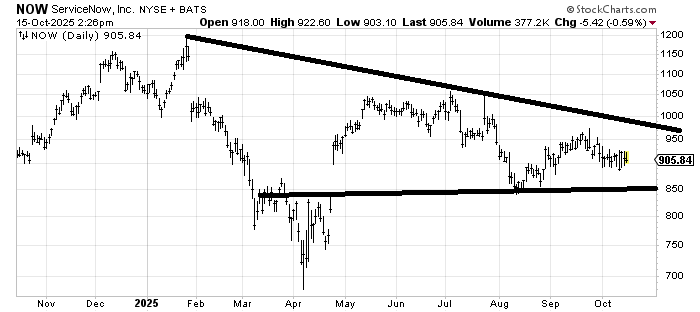
ServiceNow (NOW) has not made a higher high all year, and not since the spring has it even attempted to do so. Yet the August decline filled the gap and the rally has been nothing to write home about. I want to like it but maybe it’s the kind of stock that we wait for some year-end tax-loss selling before we take another look. If it stays over 850ish, let’s have another look before year end.
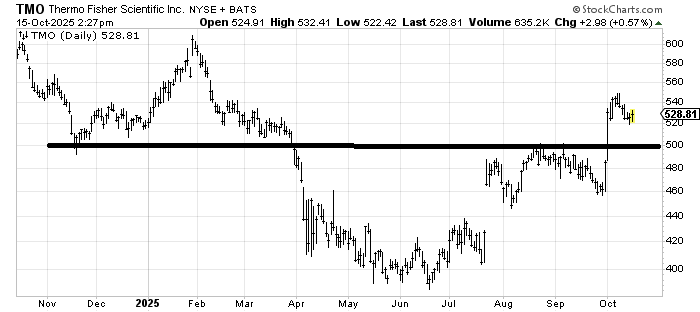
Thermo Fisher Scientific (TMO) had a nice push up through resistance. I’d love to see a dip back toward 500 to buy it, but there is a measured target around 600 now (the old high).
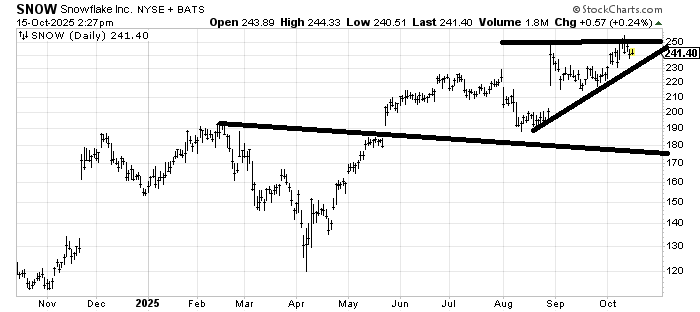
Snowflake (SNOW) has a measured target of 250, so it’s in the neighborhood where it ought to at least enjoy a sideways move or a correction. Nothing is wrong with the chart, though. If it breaks under 220, I think it will look to fill that gap at 200.
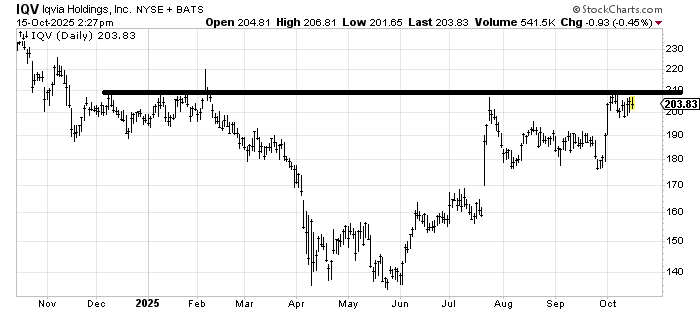
Iqvia (IQV) looks like a base. I’d love to see it get up and over 210. I’m not sure where I’d put a stop, though. I would prefer it doesn’t break under 198, but that’s not a deal-breaker because there is support at 190, then 180. But it would be preferable if it broke out in the next week or so.
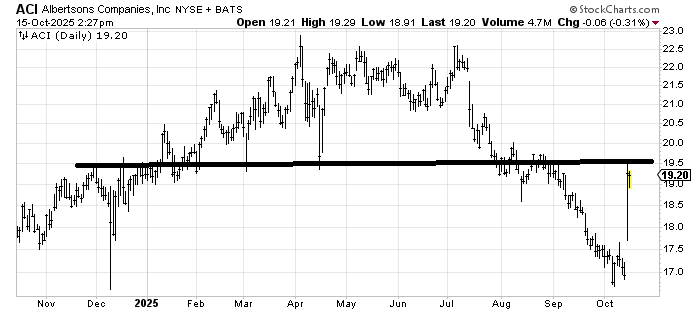
Albertsons (ACI) looks as if it ran the shorts in and then that was that (how many of those charts have we seen like that lately?). It’s got quite a bit of resistance all the way up now. Maybe if it pulls back to 18.50 it would be buyable for another trade. Otherwise it look like it could easily drift back down.
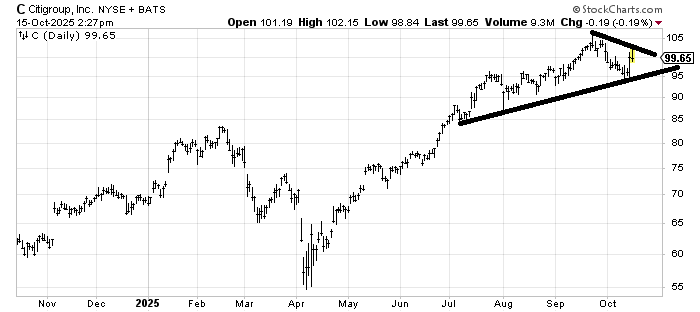
Citigroup (C) got saved at support, but you can see there is no follow-through. It’s not bearish but it just looks as if it’s had a great run and met its upside measured target. A break of 95 would be bearish.
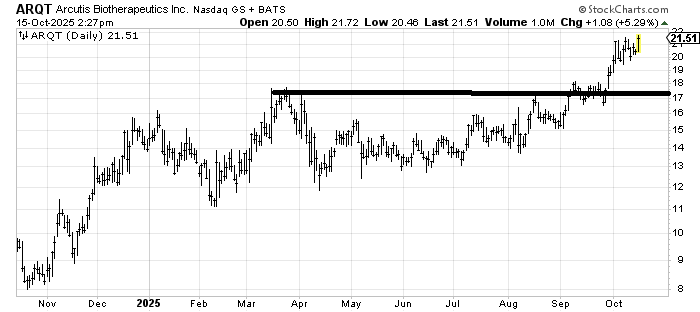
Arcutis Biotherapeutics (ARQT) has a measured target in this 21-23 area, so I’m not sure there is a lot left in the tank unless it does some more sideways work. I’d rather buy the Amgen that I liked yesterday (and before that) in the biotech area. I’ll call this a hold.
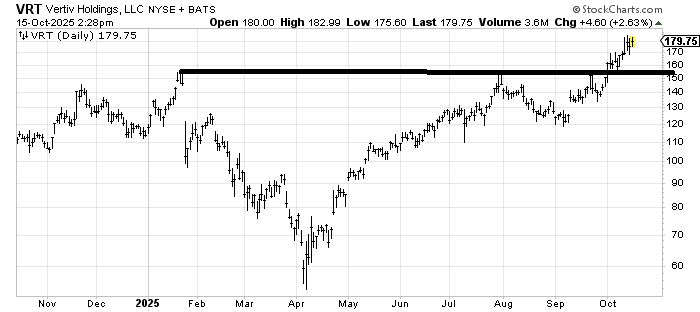
Vertiv (VRT) has a next measured target right around 180. Longer term it has a measured target around 230-250. A pullback to 150-160 would help the chart and should be buyable.
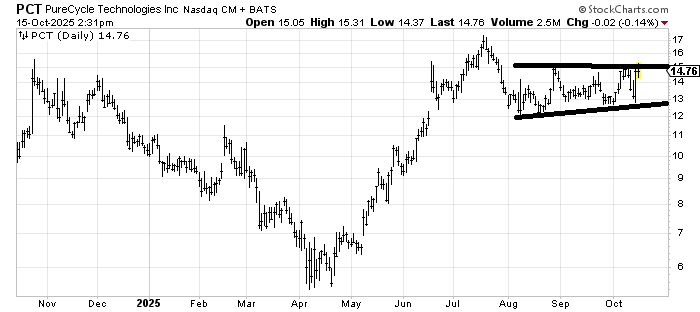
PureCycle Technologies (PCT) is the kind of chart I am drawn to. The risk/reward balance is decent in that you know you are dead wrong under 13, and it has spent a few months going sideways. A push over 15 would be good.