Keep Your Emotions in Check During a Newsy Weekend; Stick to the Indicators
So, what are the indicators telling us about the market this week?
You've reached your free article limit
You've read 0 of 1 free Pro articles.
The Market
It is always easy to get emotional after a newsy weekend such as we’ve just had. How will the market react: if it’s down, do I buy, if it’s up, do I sell? If it’s down, do I sell? If it’s up, do I buy?
I say stick to the indicators. Of course, they have not been terribly clear lately. Most have been rather directionless, as have the major indexes. The one consistent theme I have had is that if we can break that 6800 area (in reality, it is 6775, which is basically 100 points down, so that’s a lot), I think we get some panic in the market. That would remain my view.
In the last week or so, we have seen the moving averages of the various options ratios get extreme. Can they get more extreme? Of course, but what we know right now is that they would not be lifting off a low in the case of the CBOE’s put/call ratio or pushing down from a high in the case of the ISE call/put ratio. They are already well on their way, and when that happens, we can tend to get some panic.
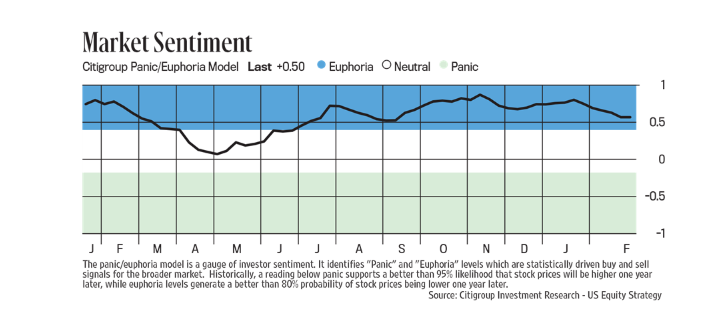
We also know that the AAII bears are now more than the bulls, so that, too, is already on its way. This past week, we’ve seen the seemingly unmoving Citi Panic/Euphoria Model move. Oh, it is not even close to panic, but it is now the lowest reading it has been since late August, so if the market can break down from here (still a big if), I suspect it falls out of that blue (Euphoria) zone in a hurry.
We know from last week that the NAAIM Exposure number is down to 75, the lowest reading since last May. That is not close to an extreme, but it is a far cry from the readings we had near triple digits just a few short months ago.
The Investors’ Intelligence survey has seen little or no shift, but I suspect we will see that survey chime in with a big shift should a break occur. I have already seen at least one advisor downgrade US stocks, and late last week, we saw UBS do so as well. Again, the sentiment has been turning for a few weeks now; thus, if we do break, the stage is set to get a possible panic.
If we don’t break and don’t get any panic, then I expect more of the same.
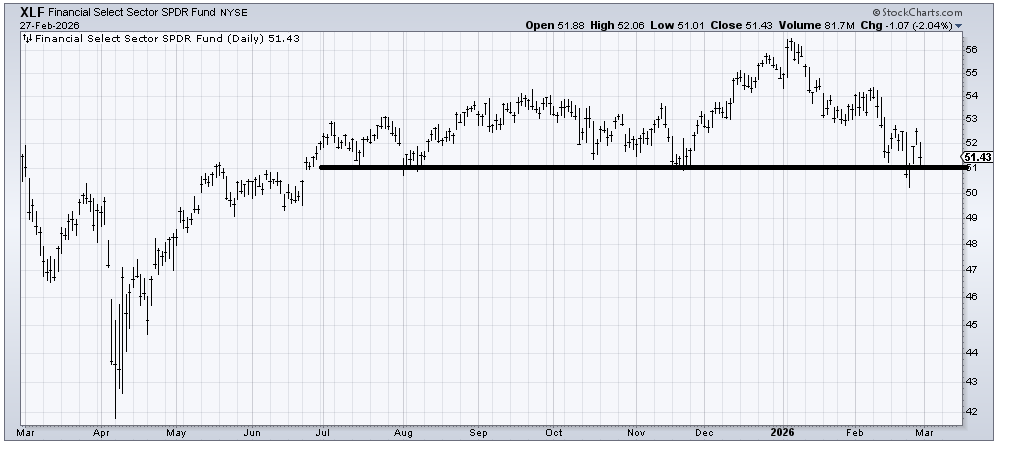
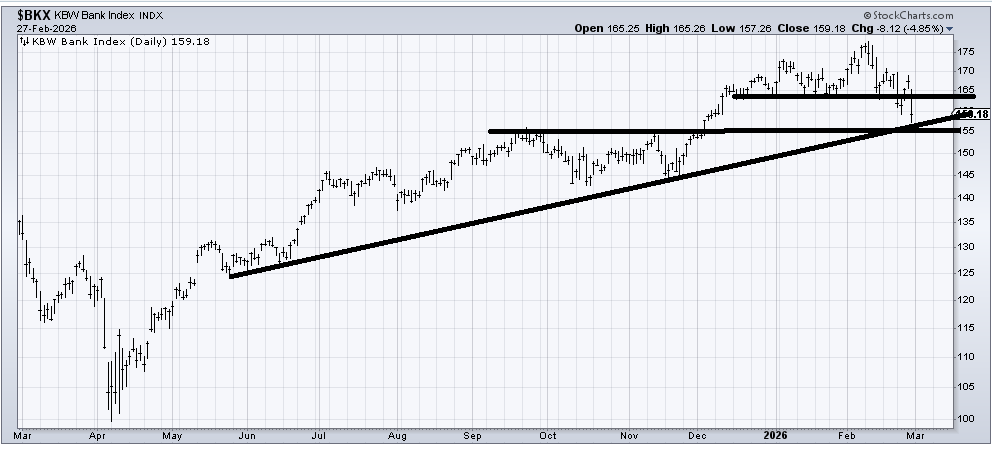
There really is not much new to say on software, but it is the financials that really should be on your screen. I have said this for months now, but I will reiterate it. Friday saw some harsh moves in the financials with the Bank Index breaking to a lower low, but the (XLF) is still above that 50.50 (gap fill) level we saw last week. The chart of XLF has a much larger top than the Bank Index, but I still think this group is over-owned.
Finally, I know the Utes have been good to us. They have also not done a thing wrong, having just pushed to a new high on Friday, but Barron’s put them on the cover, and they are overbought. I am inclined to take something off the table there.
New Ideas
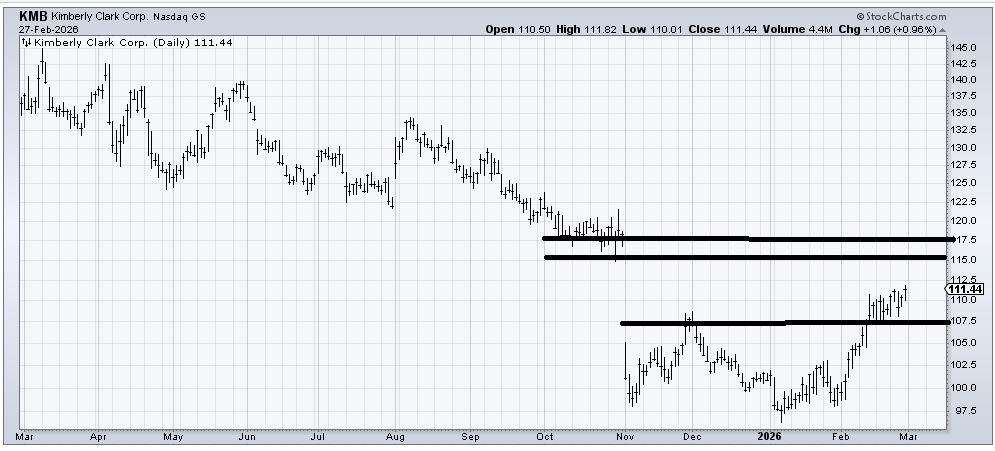
It’s been about six weeks since I first recommended Kimberly-Clark (KMB) , and it has been a slog getting this stock to rally a bit more than ten percent. I just want to note that there is a gap to be filled around 115 and resistance around 117. Should it get there, I would be inclined to take a few profits.
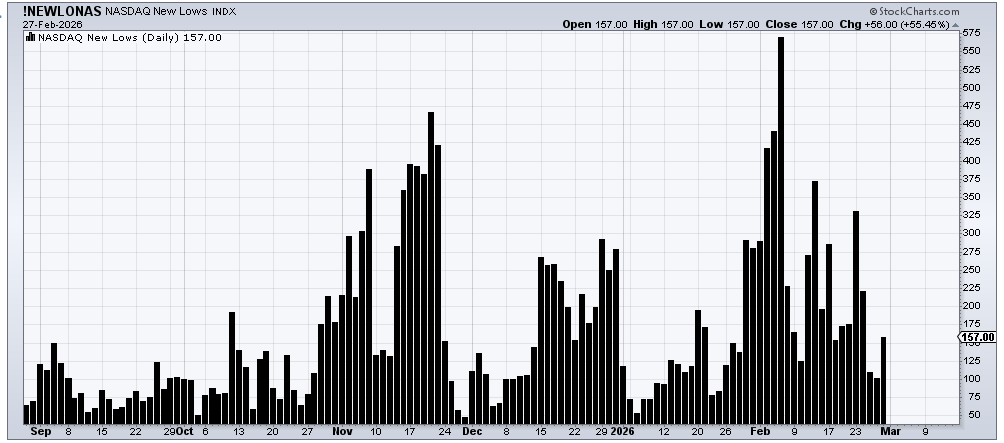
Today’s Indicator
It’s Nasdaq’s new lows that we watch, should we get a break (under 22,000). Fewer than the 569 reading we had in early February, and we’ll have a positive divergence.
Q&A/Reader’s Feedback
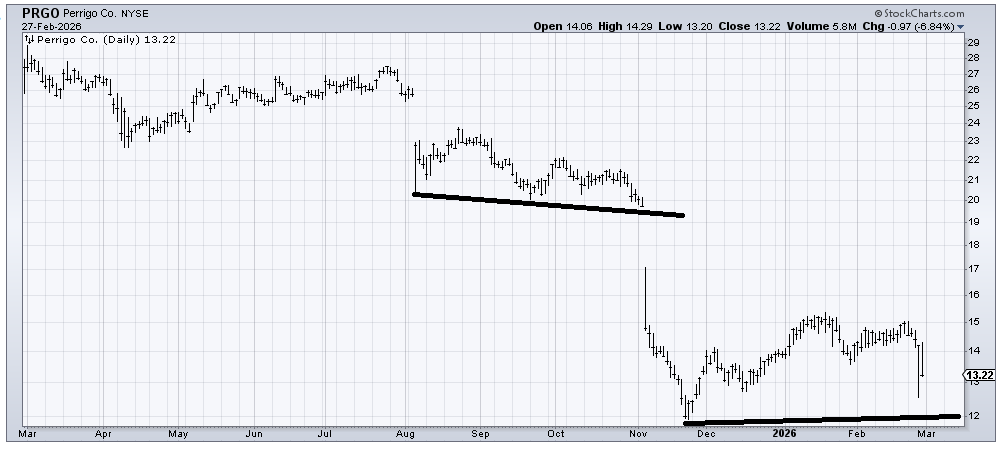
Perigo (PRGO) is one of the types of charts that I think I will like if a few months from now it is still trading between 12 and 15, because then it would look like a base. Right now, it’s on a watch list for me. Notice how, after the August gap down, the sideways action was leaky, with lower lows and lower highs. The November gap down has not yet seen lower lows, so if it can keep that up, the chart improves.
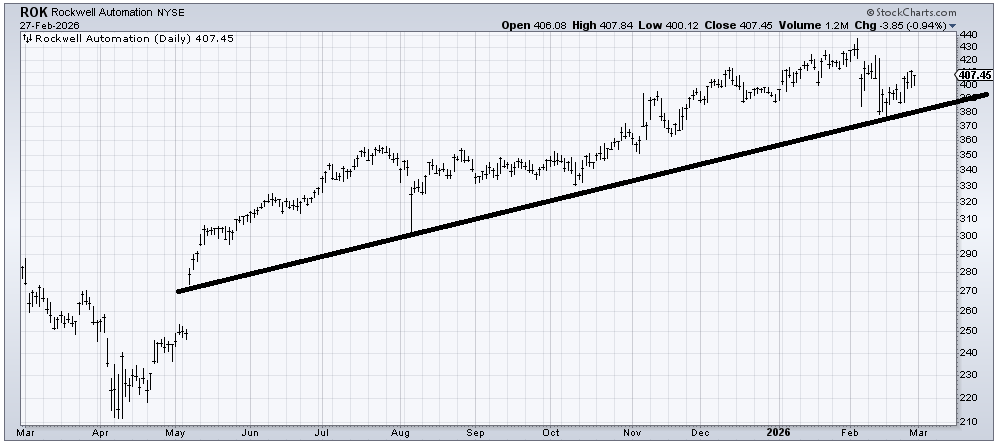
Rockwell Automation (ROK) is another chart that has done very little in the last three months. As long as that uptrend line stays intact, the stock is okay, but a break of that line and I’d turn negative on it. For now, I’m inclined to call it a hold because it hasn’t done anything wrong but looks lethargic.
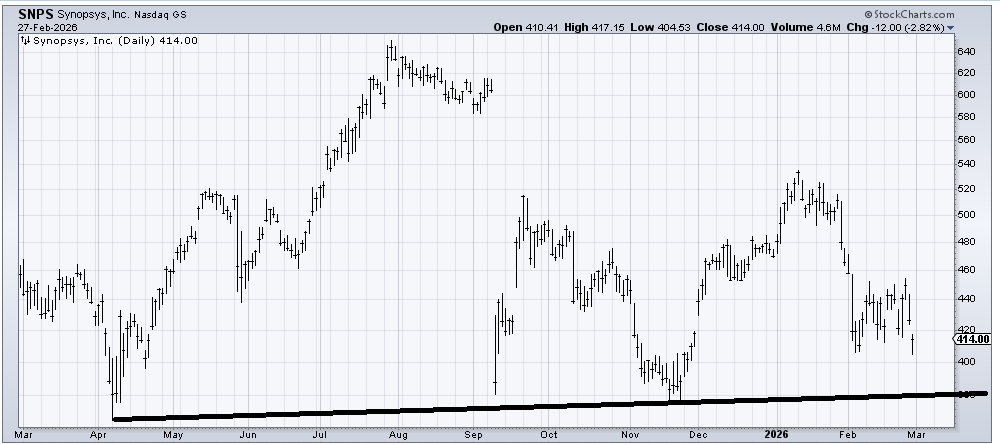
Synopsis (SNPS) is groping for a bottom. It feels a bit early to think it can do it, but put your hand on the left side of the chart (say through June/July) and picture that if SNPS is still trading in this wide range (380-520) a few months from now, this will look like a base.
If, for some reason, we manage to get some panic in the market this week and SNPS is still holding over 380, then I’d like it for a trade.