Just Do the Math. We're Clearly Overbought.
Stocks have entered overbought territory, with sentiment 'overtly bullish.' Here's what it all means and two stocks I want you to put on your screen.
You've reached your free article limit
You've read 0 of 1 free Pro articles.
The Market
So now we are overbought. Before I get to that, though, the question I want to address is if we pushed from complacent to giddy. I think we had a bit of giddiness earlier in the week with that ISE Equity call/put ratio heading over 3.0. I think we had some wild speculation with the penny stocks on the move as well.
Then there are the AAII bulls, which pushed up to 49.5% this week. That is the highest reading in more than a year. Giddy? Maybe not but certainly overtly bullish. I think I will say we are more than complacent but not necessarily giddy.
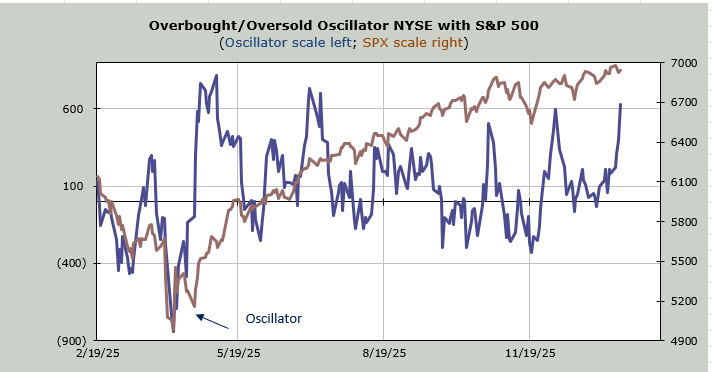
Now back to the overbought condition. As I noted Wednesday night I think the overbought condition is in the 493, which would seem normal since that’s where the action has been. You can see my Overbought/Oversold Oscillator, which is based on breadth not price, is clearly overbought.
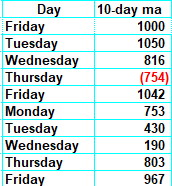
The math behind it, where I use the 10-day moving average of the advance/decline line shows that breadth has been positive for nine of the last 10 trading days. What we do is we look back 10 trading days ago to see what numbers we are dropping. When we are dropping a long string of positive numbers we are overbought. Beginning Friday this is what we are dropping:
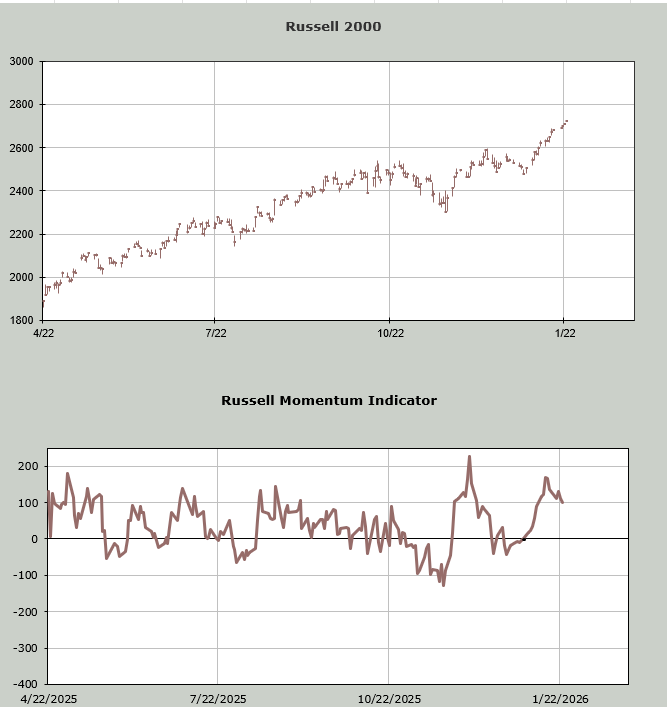
If you prefer to use price we can look at the Russell 2000 Momentum Indicator. What I do here is I plug in higher closes for the Russell over the next several days to see when/if the Momentum Indicator keeps going up or heads south. You can see it heads south.
You might recall we did this same exercise in mid-December, as we headed into Christmas week, only I plugged in lower closes for the Russell to see when the indicator stopped going down and moved up. It’s the same concept: a loss of momentum.
The number of stocks making new highs expanded nicely Thursday. Breadth continues fine as well so I would say right now I’m just expecting an overbought pullback, probably with another spurt upward in volatility. Hopefully we’ll get some good setups from a pullback.
New Ideas
I’ve got two stocks I want you to put on your screen.
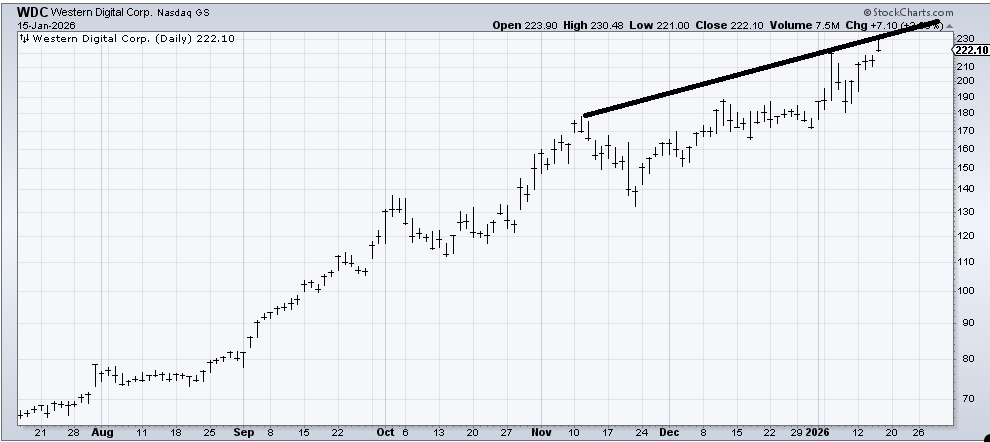
The first is Western Digital (WDC) . It’s been a super-hot stock and Thursday was no different as it gapped up. Only Thursday it closed at the low of the day. If there is follow through on the downside it would signal that this hot stock will also be part of the overbought pullback. If WDC gaps down and leaves Thursday as an island, that would be bearish.
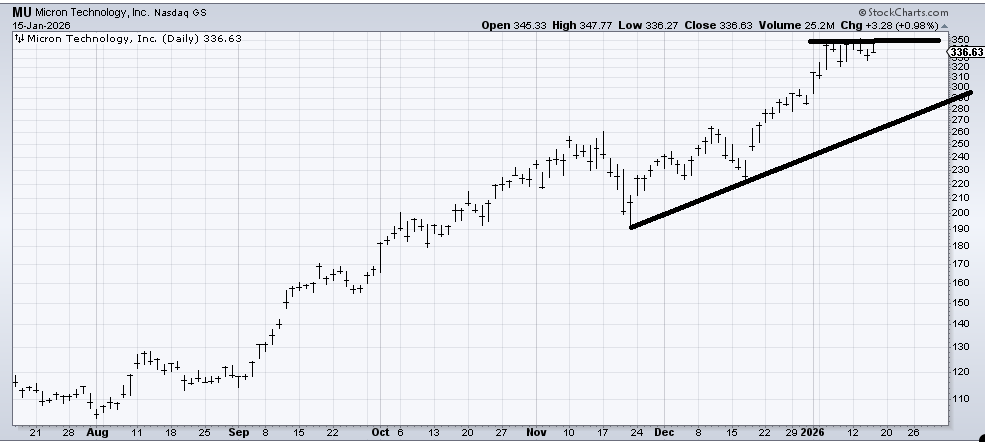
The other stock is Micron Technology (MU) . We looked at it last week and I leaned toward being a profit taker. But we want to watch it because despite the SOX making a higher high Thursday, this stock hasn’t made a higher high in almost two weeks. And it closed at the low Thursday. I think MU is due a correction. If it breaks under $320 then there is a chance it comes down to tag that uptrend line.
Today’s Indicator
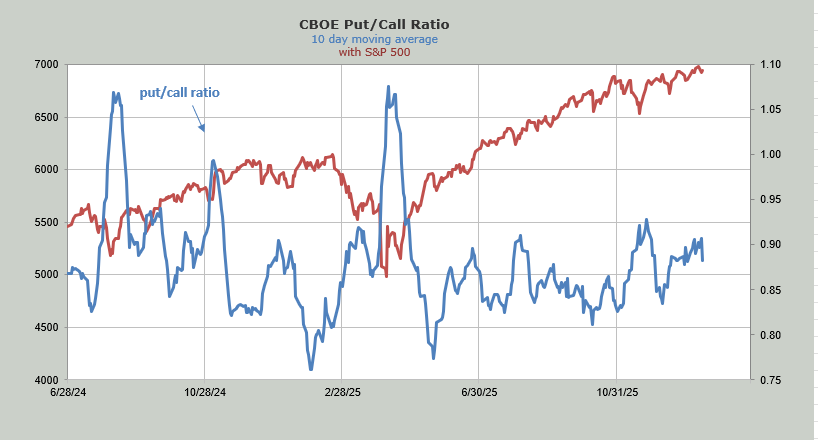
The 10-day moving average of the put/call ratio is heading down. While I hate to rationalize a move, this current turndown is because 10 days ago the put/call ratio was 1.13, which we dropped off the moving average Thursday.
Q&A/Reader’s Feedback
Helene welcomes your questions about Top Stocks and her charting strategy and techniques. Please send an email directly to Helene with your questions. However, please remember that TheStreet.com Top Stocks is not intended to provide personalized investment advice. Email Helene here.
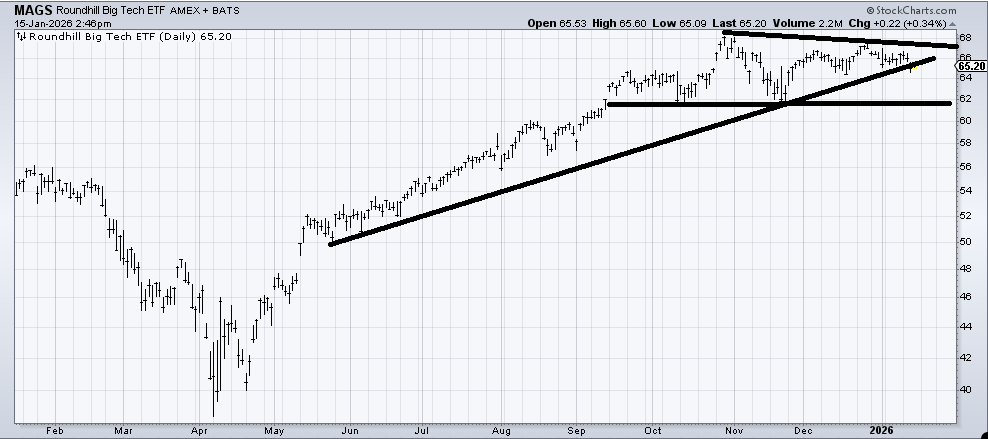
The chart of Roundhill Magnificent Seven ETF (MAGS) , an ETF to be long Big Cap Tech looks pretty similar to the QQQs. There is some support here, but a break here and I think that lower line ($62-ish) comes into play.
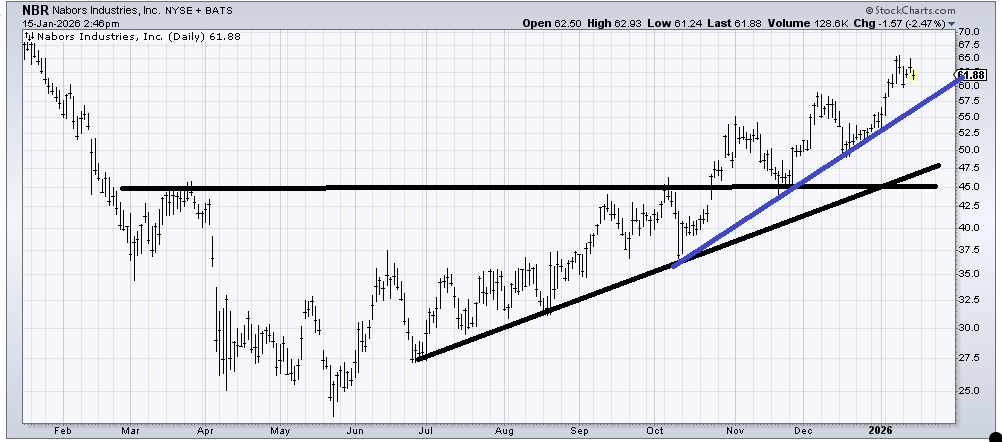
Nabors Industries (NBR) has met its upside target of $65 so a correction is not out of the question. I would love to see if it can get to the blue line ($57-ish) and hold on. My guess is a bounce from there.
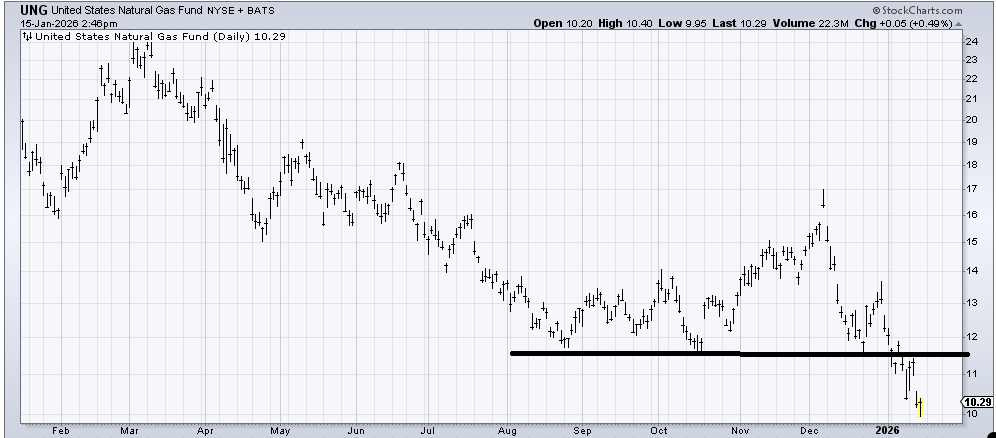
I often refer to United States Natural Gas Fund (UNG) , an ETF to be long natural gas, as a widow maker and I hope you can see why. It is getting oversold down here. The DSI was 28 Wednesday night, which is not that low. For now I’d say a rally to $11.50 would be a good place to sell it.
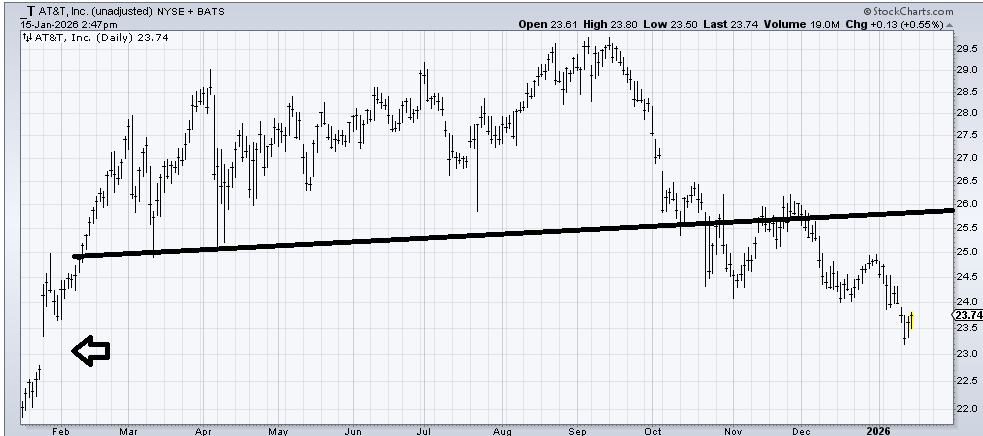
When AT&T (T) started breaking down I decided I wanted it to fill that gap from February last year. It would complete a measured target as well. If it can drop down there I would look to buy. Alternatively, if it can recapture $24 like it means it then I’d take another look at the stock.
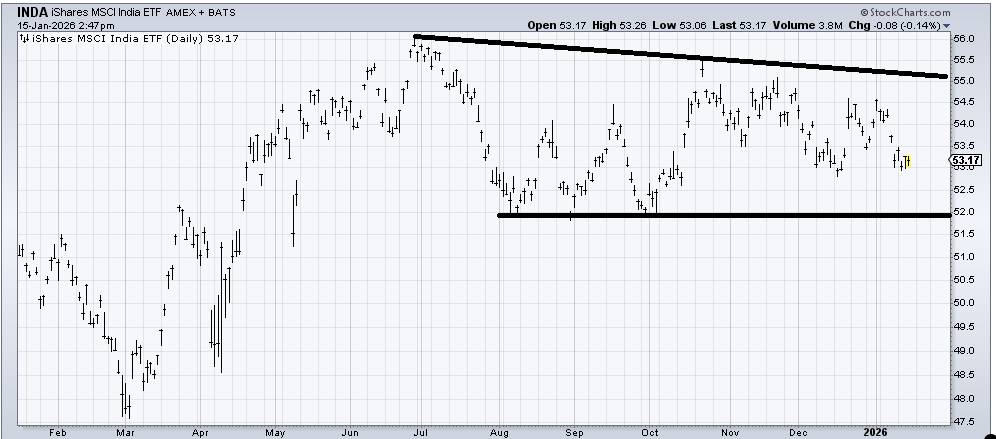
I still think iShares MSCI India ETF (INDA) , an ETF to be long India, is trying to bottom but boy has it been frustrating. As long as it stays over $52-ish that’s my plan: that this is a bottoming process.
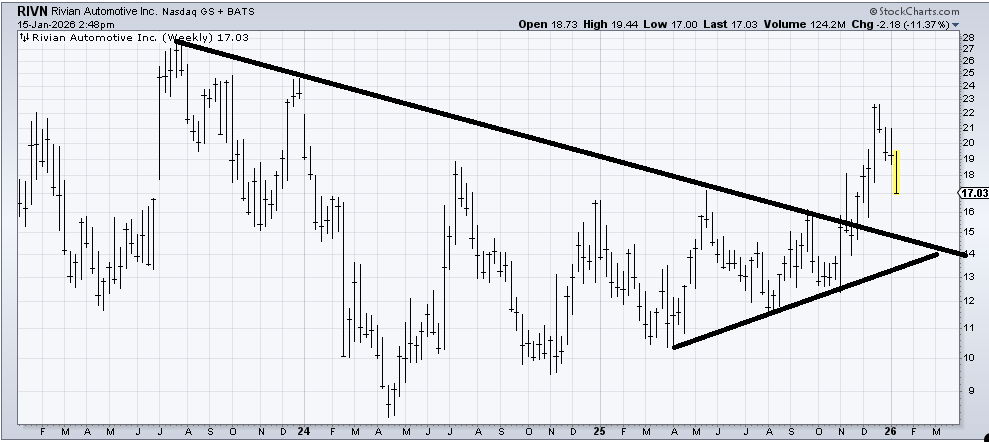
Rivian (RIVN) continues to look like a base on a weekly chart. A pullback into that $15-ish area is probably where it gets interesting again.
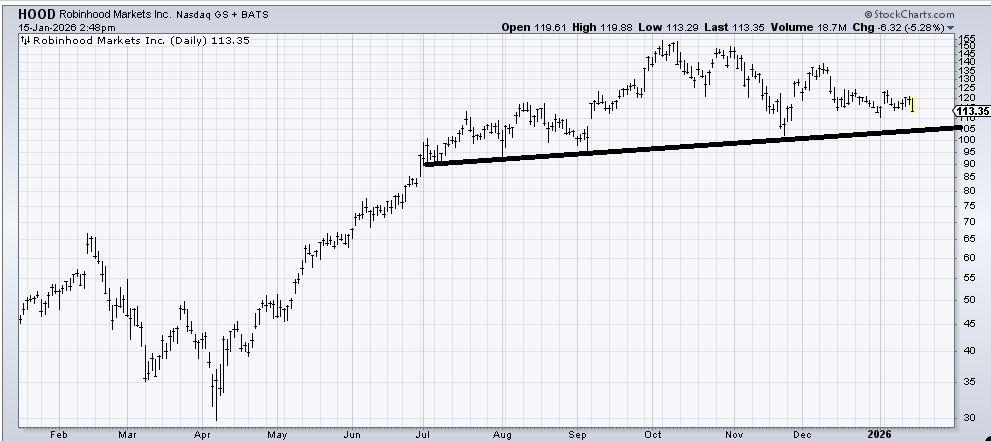
Robinhood (HOOD) still looks to me as if it is coming down to that lower line. If that lower line does not hold and instead breaks, that would complete a top. If it holds this is just a giant consolidation.
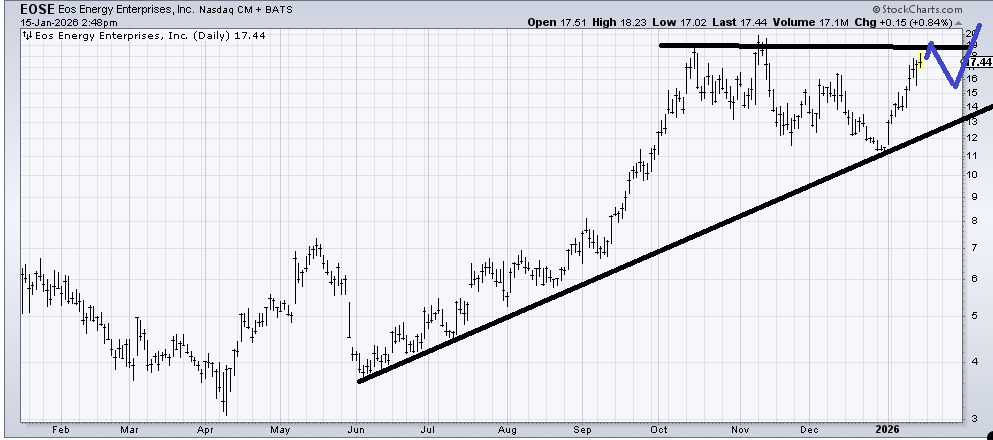
I don’t know if Eos Energy Enterprises (EOSE) can map out as I have drawn in blue, but if it can then the chart would look good to me. Let’s see if that pattern can play out.
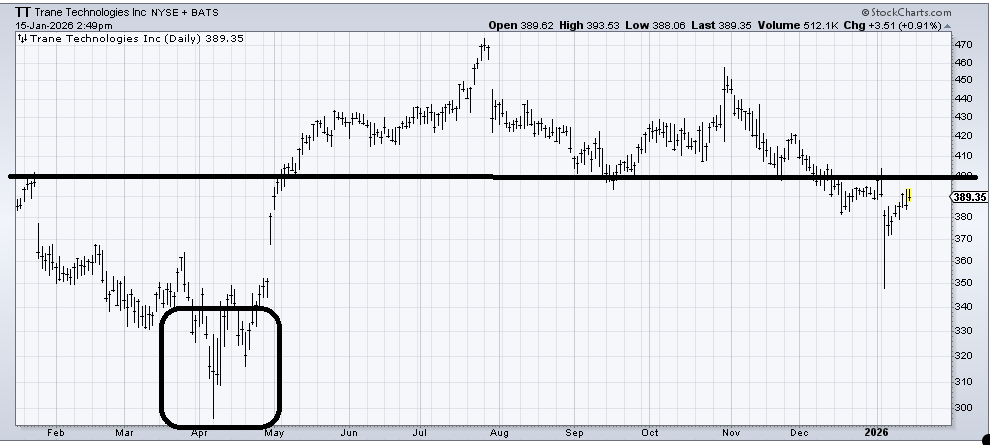
Trane Technologies (TT) tagged $350 early in the year, which managed to fill the gap (from last April) and met a downside measured target. It’s going to take some work to chew through the resistance overhead now but pullbacks should improve the chart. Notice on the left side of the chart the way the stock formed a "W." I would love to see a similar pattern.
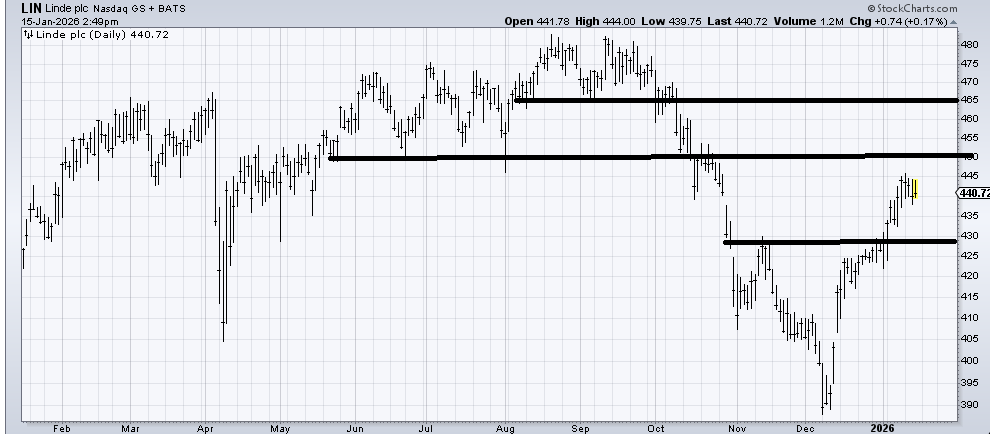
Linde plc (LIN) is trapped between support and resistance so I’d like to see a pullback to the $430 area to be a buyer.