It's Nvidia's Market. The Others Are Dropping Like Flies.
In this either/or market, when Nvidia rallies, there's little demand for shares in other stocks.
You've reached your free article limit
You've read 0 of 1 free Pro articles.
The Market
For the longest time, I have noted that when Nvidia (NVDA) rallies, it sucks the life out of the rest of the market. It’s just an observation I have. But today I saw a data point that I want to share with you.
The Market cap of NVDA is now bigger than the entire market cap of the S&P Midcap 400 AND the S&P Small Cap 600. Stop and think about that for a minute. One stock equals the entirety of two whole indexes.
When we think of it like that, it’s easy to understand why we have an either/or market when it comes to NVDA.
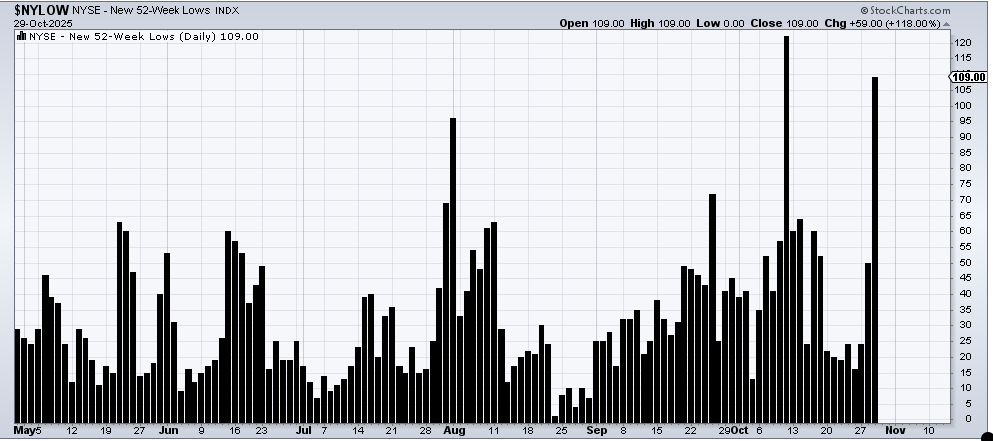
As for today’s market, if you thought breadth was bad yesterday, today was worse. Yesterday was a lot of dribs and drabs, not a lot of ‘several percent down’. Today was a lot of ‘several percent down,’ and the number of stocks making new lows on the NYSE more than doubled. Nasdaq’s new lows didn’t quite double, but they, too, rose quite a lot today.
Oh, sure, part of it is possibly tax loss selling, but we’re now into tax loss selling season, so we’ll get some relief, and then it will return (mutual fund tax loss selling should end this week).
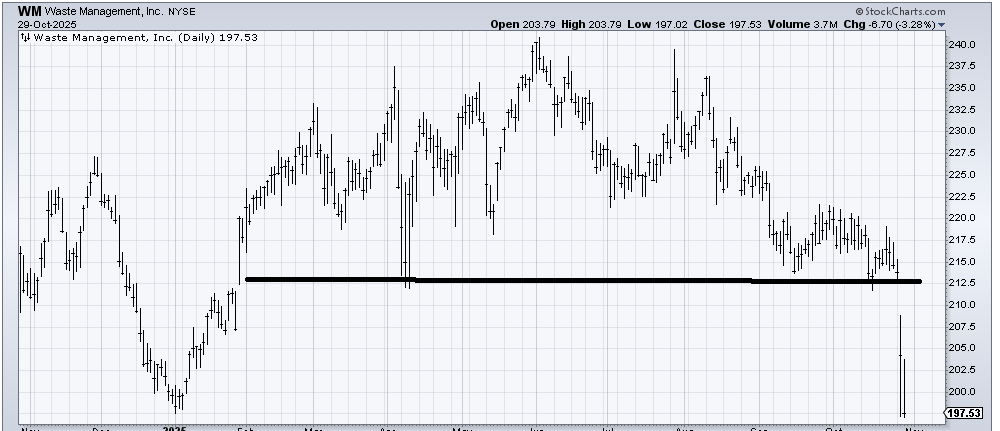
But there are stocks already down a lot that then gapped down to new lows. Look at Waste Management, which we looked at a few months ago, and I wondered if the stock might hold that 215 area. The answer is clearly no.
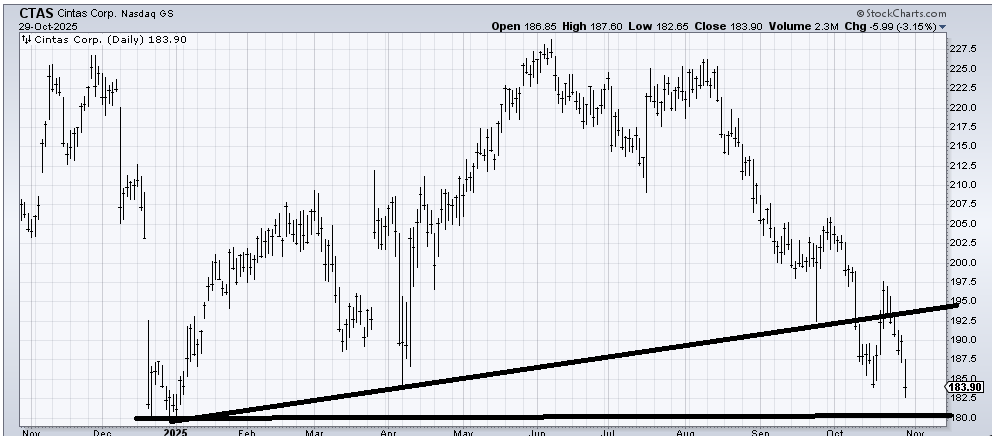
Cintas (CTAS) is an entirely different business, and it took out the October low, but not yet the January low. But that is not a pretty chart.
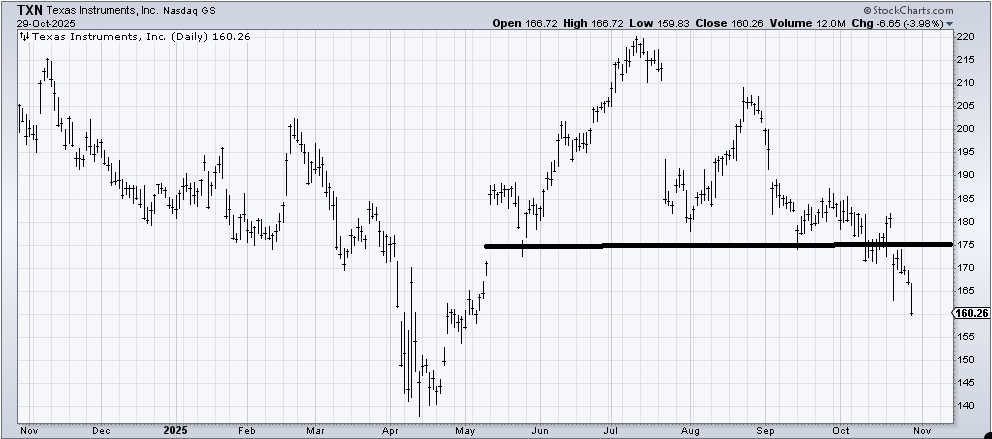
If you think tech stocks—heck, semi stocks—are okay, then take a look at Texas Instruments (TXN) , which is fast becoming the Intel of the group.
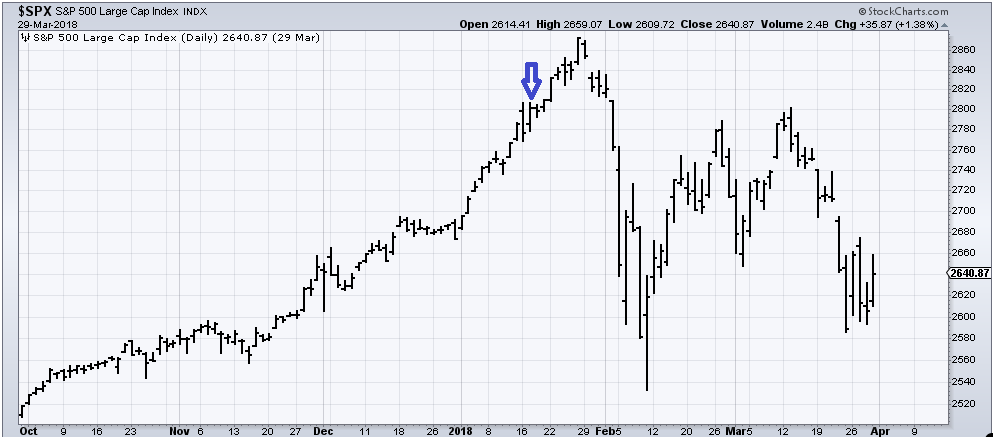
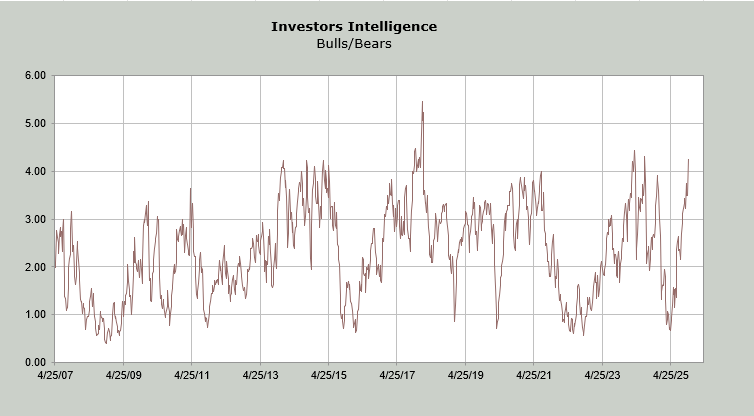
All of this shows up just as yesterday’s DSI for the S&P and Nasdaq got to 84 (today they are 80), and the Investors Intelligence bears are down to 13.5%, the lowest reading since January 2018. The S&P actually rallied for another two weeks—and rallied quite a bit—but in the end it succumbed. The blue arrow is when we got that reading.
The ratio of bulls to bears is now at 4.2. I have noted for the last several weeks that I would consider it giddy if we got over 4. Here we are.
So, sure, the market can keep on cracking onward, but I’m going to need an oversold condition and stocks that act a lot better, as well as a higher level of fear, before I trust the market.
New Ideas
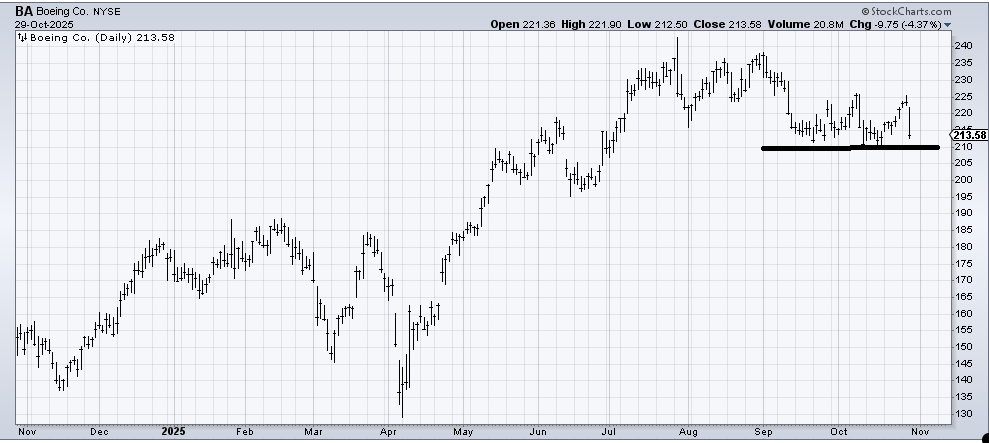
I have thought for a few months now that Boeing (BA) would hold and rally off 210. It did so, but it did not rally as it should have. If the stock breaks 210, I’d consider that bearish.
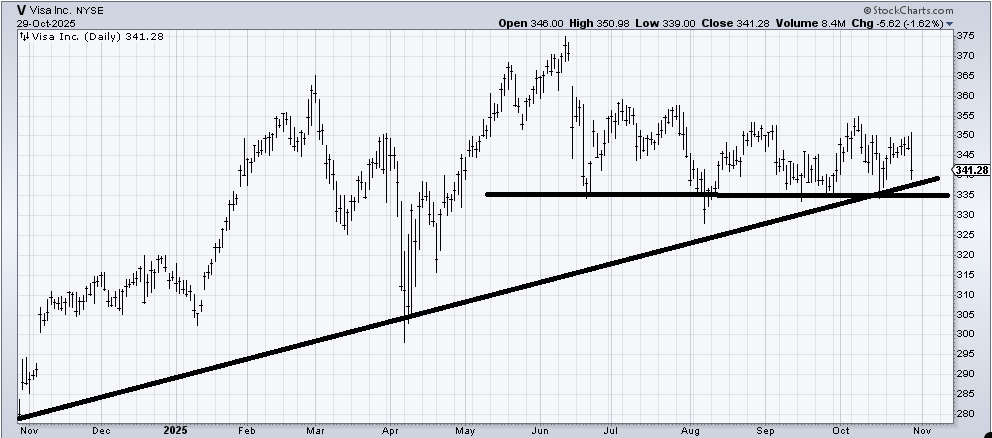
We’ve talked about Visa (V) quite a bit, but it has refused to break down. Watch that 335 area.
Today’s Indicator
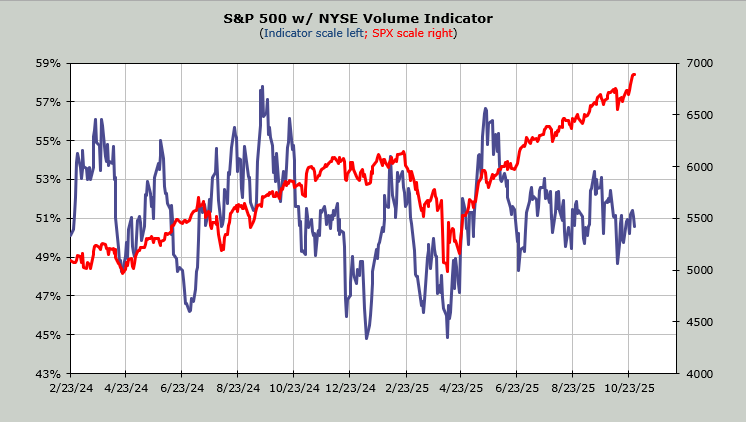
The Volume Indicator is still at 51%. It truly does not budge.
Q&A/Reader’s Feedback
Helene welcomes your questions about Top Stocks and her charting strategy and techniques. Please send an email directly to Helene with your questions. However, please remember that TheStreet.com Top Stocks is not intended to provide personalized investment advice. Email Helene here.
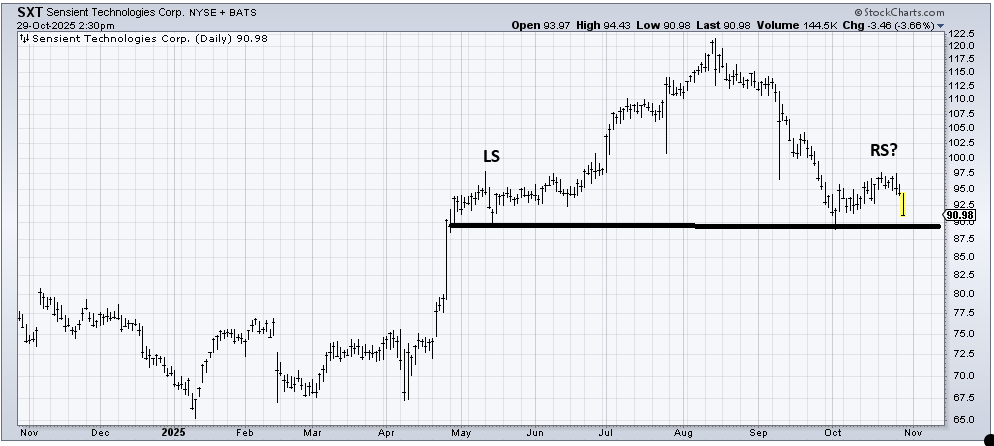
Sensient Technologies (SXT) had better hold this 88-ish level or it will complete a head and shoulders top.
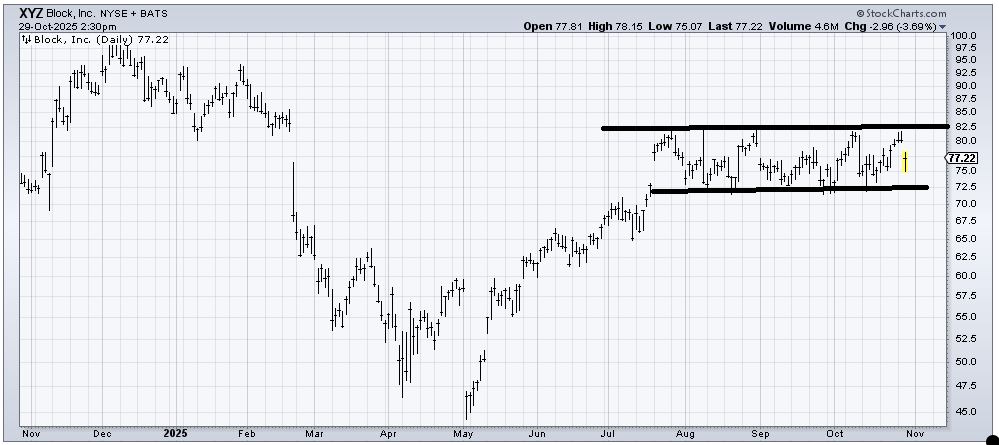
I don’t have a strong view on Block (XYZ) here. We had a good trade in it last summer, but it hasn’t done anything since being added to the S&P. For now, I’ll call it a trading range, and I would respect a break in either direction. I just have no feel on which way it would break.
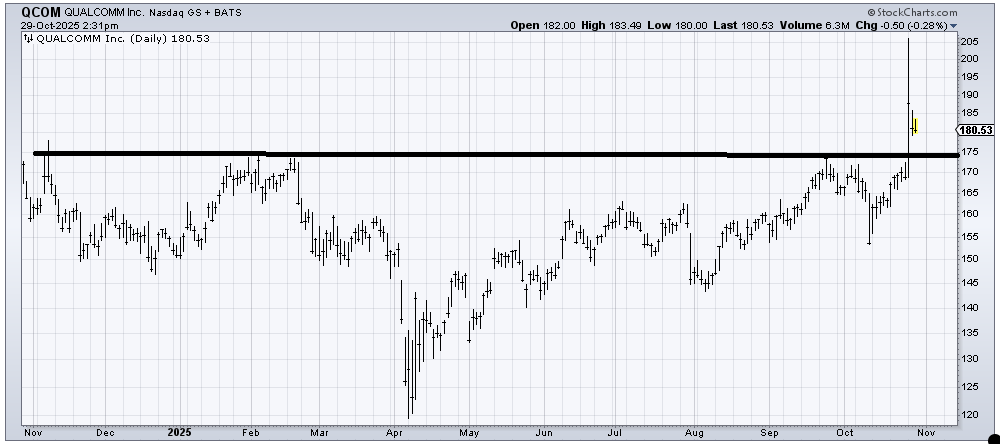
I had drawn in the head and shoulders bottom on the chart of Qualcomm (QCOM) a few weeks ago but I did not expect it to occur in one day. It does measure to 225 but there has been no follow through so I’d be careful, especially if it breaks 175.
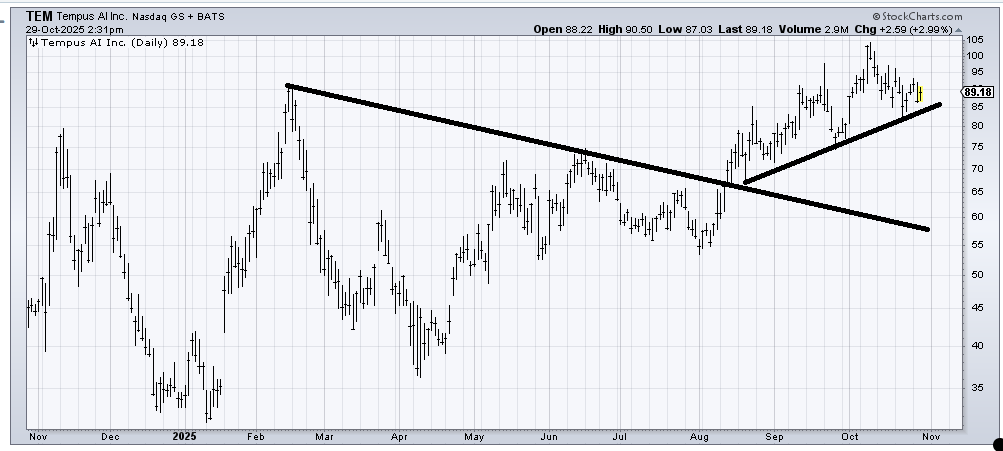
Tempus AI (TEM) is trying to consolidate its gains. I’d get cautious if it breaks under 80.
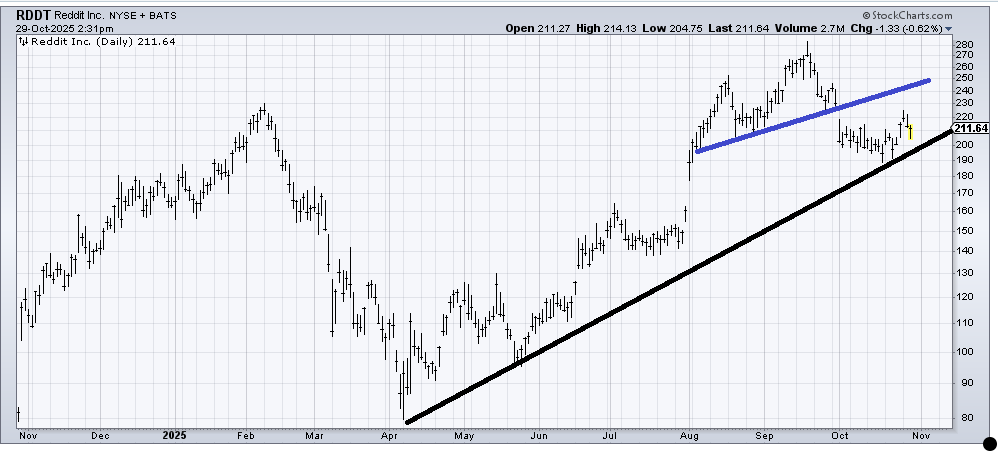
For now, I’ll say that Reddit (RDDT) is caught between the black and blue lines. If the stock can stay over the black line for a few more weeks, I might be interested in buying it with the thinking that it has done enough work since August. If that line breaks, then I’d look for that gap at 150-160 to fill.
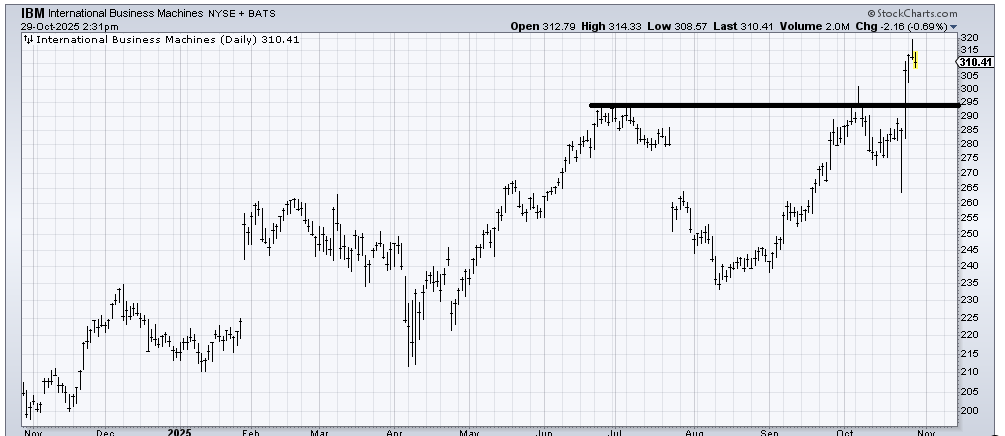
IBM (IBM) shook out the longs and the shorts on that action last week (down to 265 and up to 310). It could use a pullback. I’d like to see how it looks on a pullback to 290-95.
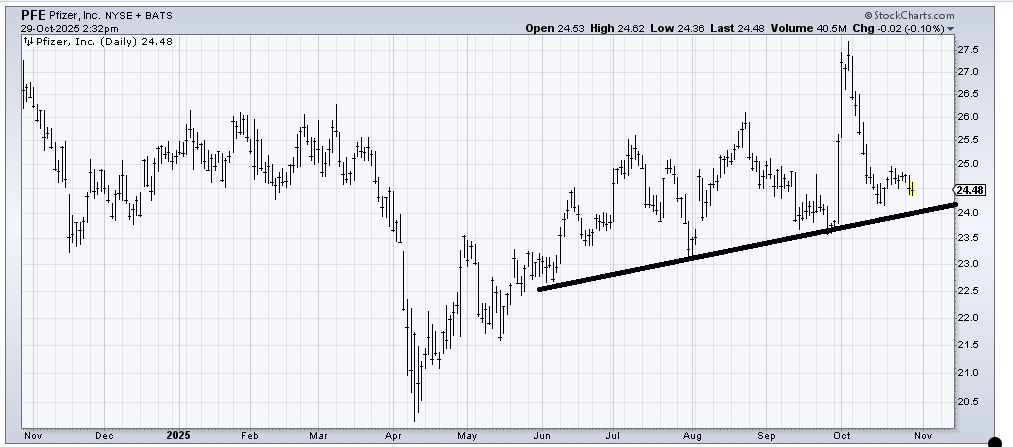
Do you see the way Pfizer (PFE) ran the shorts in, and that was all the buying there was? How many times have we seen that in almost any stock that is not a tech stock (and even some of those have done this!). If all rallies begin with short covering, the next phase is real buying. That hasn’t occurred in PFE yet. I’m eyeing 23.50-24. If that can hold, then PFE may be a good buy for 2026.
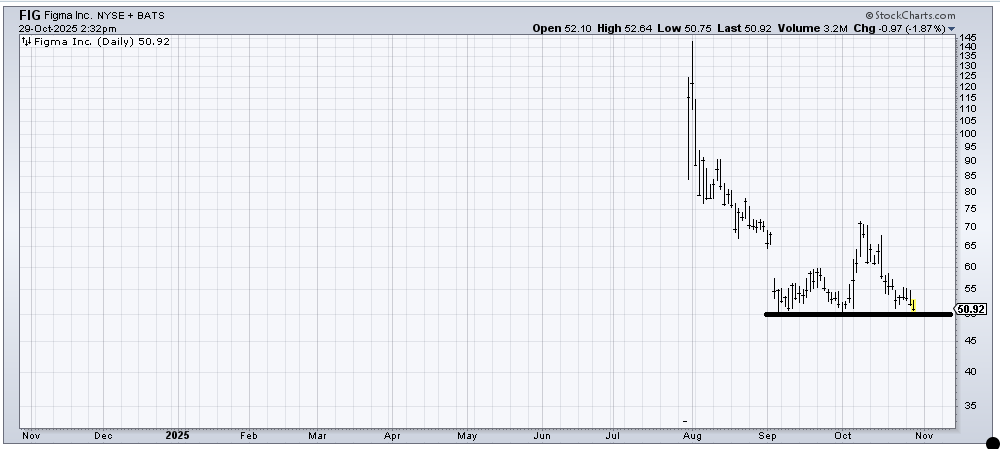
Figma (FIG) is oversold. It is also making its second trip to the lows. My view is that the first trip down to the lows often holds (and rallies). The second or third ones are not as clear-cut on that score. If FIG breaks this 50 area, I’d get concerned because the next target would be down near 30.
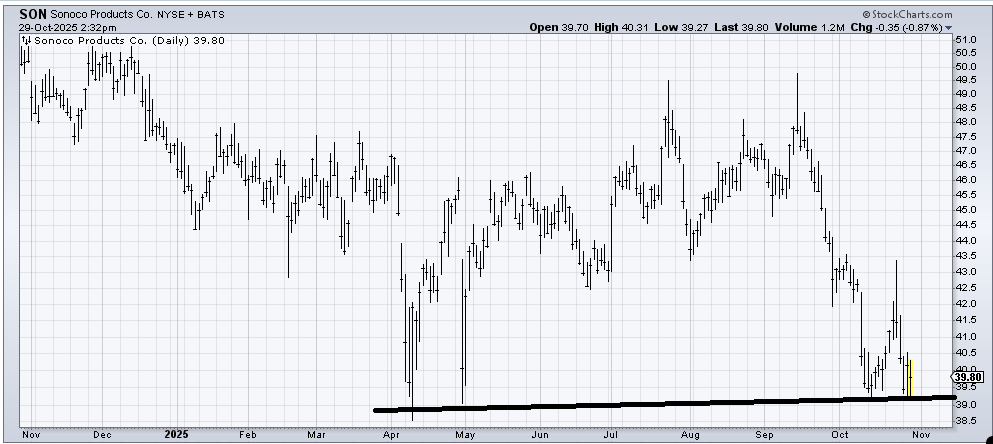
Sonoco Products (SON) is a clear example of retesting the low. The late April test of the early April low resulted in a tradeable bounce. The October test was not as good a bounce. And now I would say this better hold. The risk/reward isn’t bad, though, because you know you are dead wrong under 39. Respect that stop though.
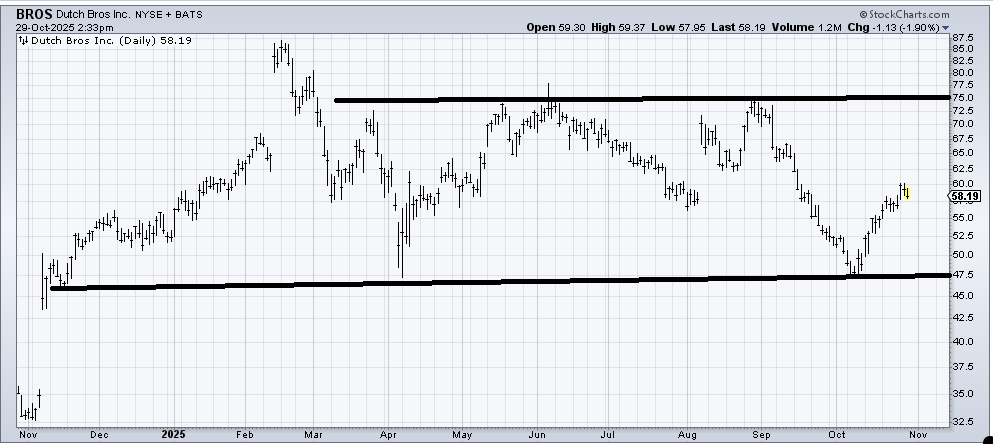
Dutch Bros (BROS) is in a wide trading range (47-75). Let’s say BROS pulled back to the 53-55 area and held, then I’d buy it for a rally toward the top of the range; otherwise, I see it in the middle of nowhere here at 58.