It's Easier to Find Stocks That Have Cratered Than Stocks That Are Up
It's earnings season, and there are lots of stocks that have fallen apart.
You've reached your free article limit
You've read 0 of 1 free Pro articles.
The Market
I saw someone on TV today highlight that we have individual stocks moving a ton. They did not say it was due to earnings, but it was. She went on to highlight all these stocks that were down. She cited Pepsi, PayPal, and Microsoft. She immediately moved toward what was up, and the only stock she could cite was Palantir.
I thought surely there must be other names that have surged like PLTR. Yet, it is hard to think of one. I could count Meta, but it really didn’t gap up on earnings; it just continued its rise. I could cite Netflix, which gapped up weeks ago and held its upside.
Last week, I cited WHR and PKG as stocks that had fallen apart. But I really am hard-pressed to come up with a list of stocks that have surged on earnings. That’s probably why we remain stuck in this range and why we continue to see volatility and chop.
It’s also why I don’t expect to see it change.
It was nice that energy powered higher today, but XLE was down seven percent in the last two weeks; it was entitled to rally.
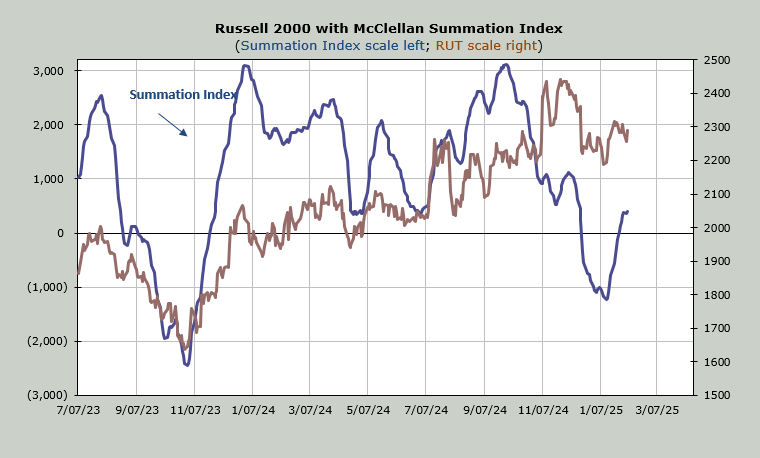
As for today’s statistics, not much changed. The McClellan Summation Index stalled out. It hasn’t rolled over yet though. That would require tomorrow to be a down day with negative breadth of around -700 on the NYSE. The chart is shown below.
The Summation Index for Nasdaq continues to roll over. On this chart, there is only one period of time that Nasdaq did not have a decent correction after this indicator rolled over and that was January last year when we went into a Mag 7 market. It mattered a bit when the April bank debacle showed up as Nasdaq took a spill.
I think what we have now is the Mag 7 are diverging among themselves. It’s possible we will lose Google tomorrow, or at least, it appears it will retreat to the bottom of the range. None of these stocks have broken down, but they are no longer the leaders. They still move the index up and down, but they are no longer ‘one decision’ stocks.
So that’s what we need to watch: will any of these index movers break the bottom of their range? The SOX is the obvious one to watch, but so is MSFT since both are near the bottom of their ranges.
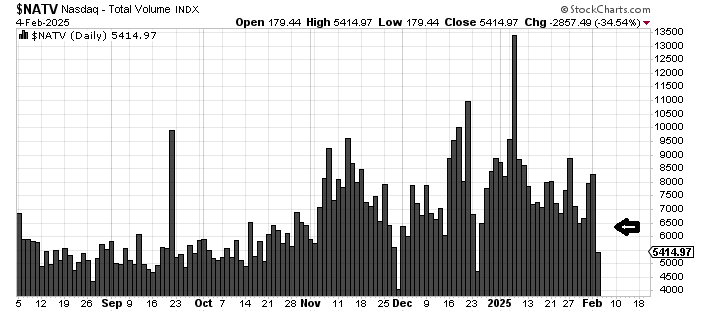
Finally, regarding Nasdaq volume. Early in the year, I talked about all the speculation and volume which you can see on the chart of Nasdaq volume. I think this hasn’t been fully updated yet for Tuesday’s trading, but Tuesday’s volume was where I have placed the arrow. Notice that the overall volume has been trending lower in the last week or so. I would like to see it more normalized (roughly 5 billion shares a day) but that usually comes after a steeper correction than we’ve seen.
New Ideas
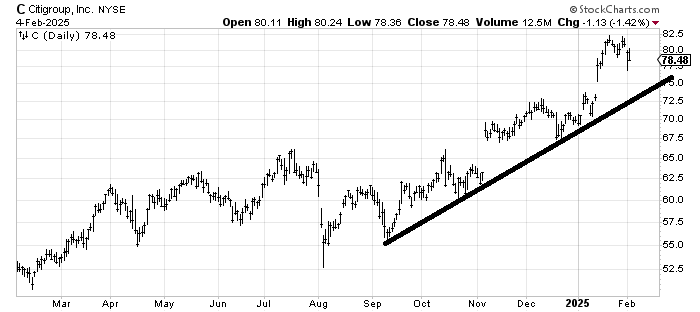
I was asked to look at Citigroup last week and I thought it needed a pullback. But the action over the last two weeks has me concerned it needs more than just a pullback. It might just need to come down and tag that line which is almost ten percent lower from here. It would also fill the earnings gap.
Today’s Indicator
The McClellan Summation Index is discussed above.
Q&A/Reader’s Feedback
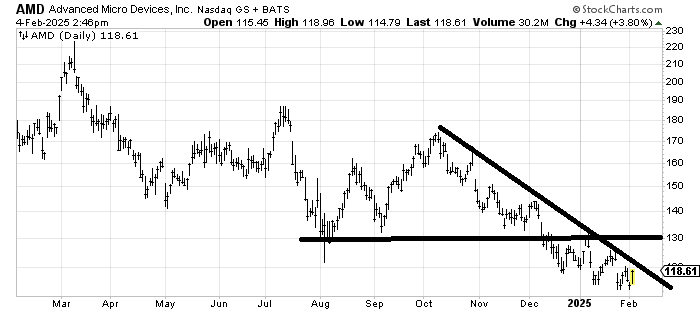
I tried to bottom fish Advanced Micro Devices AMD a few times last year and got burned almost every single time. Is there anything different now? The only thing that is different—or could be—is if it can cross that downtrend line. That doesn’t take it out of the woods but it changes the pattern that has been in place for our months now: lower lows and lower highs. I still think there is a lot of resistance at 130 but crossing that line makes a difference.
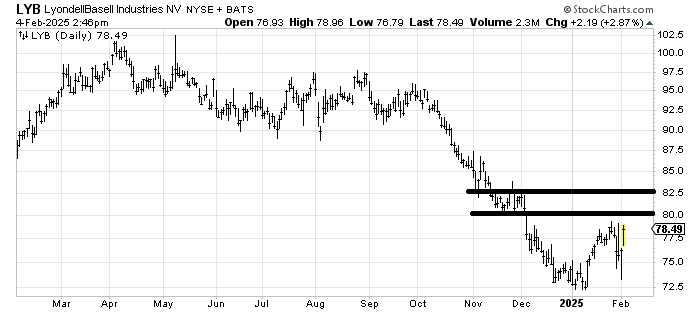
I would guess Lyondell Basell LYB can rally to 80-82 before it runs into enough resistance to stop it.
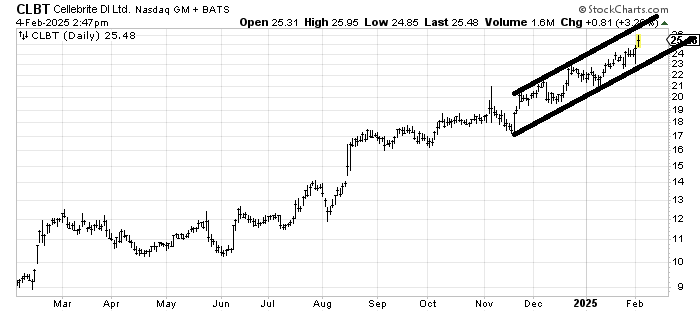
There is not much to say about Cellebrite CLBT except it is a stock in an uptrend and within that uptrend it is in a well defined channel since November. If you are trading it you buy the lower line and sell the upper one. If you are an investor you hold on unless it breaks that lower line.
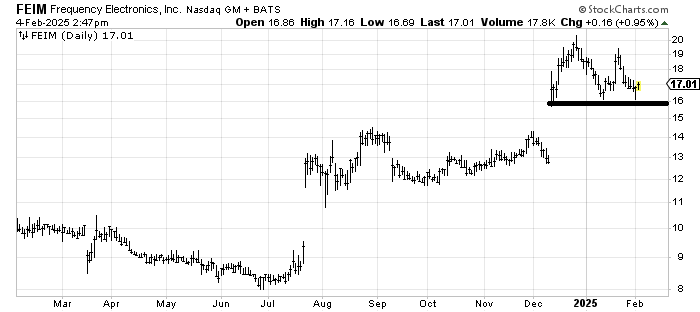
Frequency Electronics FEIM used to have a different ticker symbol (!!). As long as it holds over 16 it looks to me like the stock is a buy with a stop under there. Next resistance is 19-20.
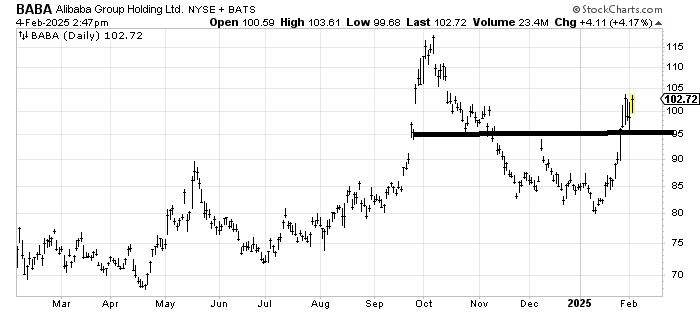
Alibaba BABAF has resistance all the way up but that base it broke out of measures to the 110 area as a next target. I would use a stop under 95 and move it up to 100 if the stock gets over 105 readily.