It Would Be Good for Despair to Turn to Panic
We're not going to have a sustainable rally until the market washes out. Could that happen this week?
You've reached your free article limit
You've read 0 of 1 free Pro articles.
The Market
We came pretty close to seeing our first signs of panic on Friday. Am I being a stickler by wanting to see 90% of the volume on the downside? I am. It was 87% on Friday.
But it’s not just 90% of the volume on the downside. It’s a soaring put/call ratio. Why were folks so keen to load up on puts in October or August last year but not now? Friday, for all the downside action, saw the put/call ratio at 1.02. At least the reading was over 1.0.
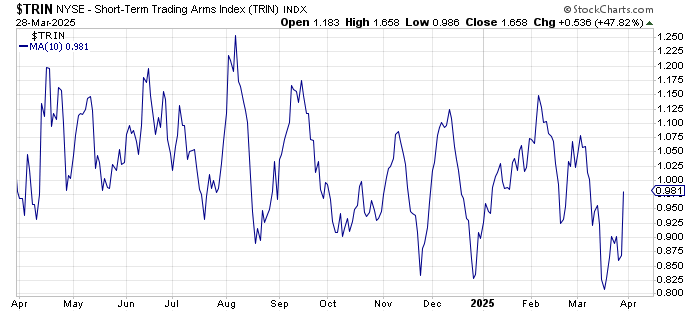
I can even show you the ten-day moving average of the TRIN. TRIN stands for Trading Index. Some of you may know it as the Arms Index. It is a measure of the A/D line and Up/Down volume combined. Look where it was in August: 1.2. Heck, folks apparently did more selling (because that’s what it measures) into late January when the reading was 1.15 than they have now.
But now, I want you to consider what I wrote on Thursday evening. A few more down days, preferably big ones, preferably ones with some panic, should lead us to another trading opportunity on the long side.
My own Oscillator would be back to an oversold condition later this week. If we got some panic selling, that TRIN chart above should rise quite a bit. Maybe we would even get the put/call ratio with some solid readings over 1.0.
And now there is this. The DSI on Friday for Nasdaq was 23. I don’t think we can get it to single digits that fast (i.e. late this week) as that ‘last mile’ is the slowest but with some selling—preferably panic selling—early this week we should be able to get that under 15.
And maybe that NAAIM number would fall. Also, not likely to an extreme reading such as 20 but why not into the 30s?
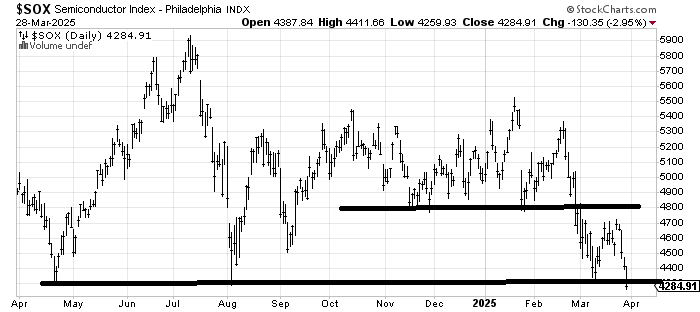
There were very few charts that made lower lows. New lows are still fewer than they were in early March. Oh, sure, the SOX did it (as it ought to) but it wasn’t as if it plunged under there. You need to squint to see it. Break it like it means it, and that would be the first place I would look for an oversold rally.
Friday’s selling was the first down Friday in five weeks. There used to be an adage that buying on Friday was hopeful, but selling on Friday was despair. I’d like the despair to turn into panic, and this week would be a great time for it.
New Ideas
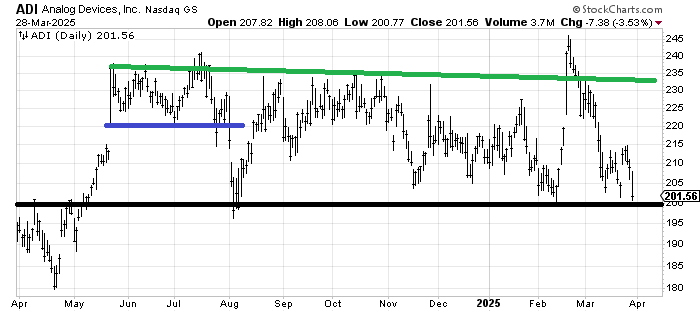
Let’s talk about a semi stock that no one ever looks at, or cares about, but seems to me a great example of what I’m looking for. Analog Devices ADI has some serious support at 200. If it breaks that, we ought to see some panic.
But now look at July/August to see what I’m talking about. Look at the break of the blue support line: a plunge with panic and a rebound. Notice it also happened on the other side of the ledger. In February, the stock surged over prior highs (panic to cover shorts?), and that was that.
So yes, I’d like to see this break to set up a rally. Don’t take this as a bullish call on semis, take it as a trading call.
Today’s Indicator
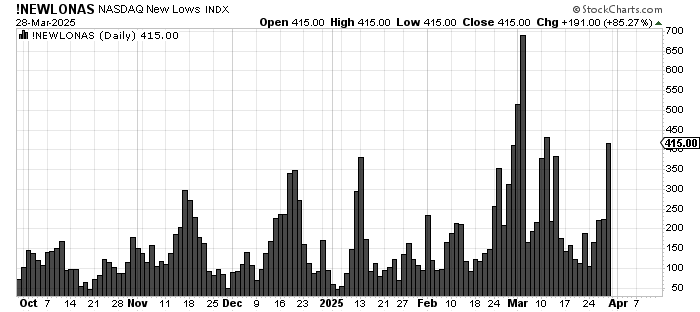
New lows on Nasdaq are high, and if we break from here, they ought to expand, hopefully, there would be fewer than 688, the reading we saw in early March.
Q&A/Reader’s Feedback
One thing you will notice is how none of these stocks, as bad as they feel and look, have made a lower low. That is what the number of stocks making new lows is telling us: no breakdowns. That would be great if we had some panic, too!
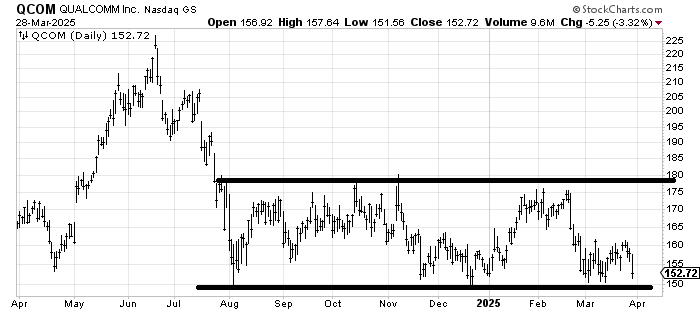
I suppose I could have used Qualcomm QCOM as an example for a breakdown that should rebound. A break of 150 should cause some panic. But let’s say it holds. So, it rebounds, but unless it can get up and over 160, it would be just more of the same lower highs. A break of 150 with no panic means a longer-term measured target of around 130.
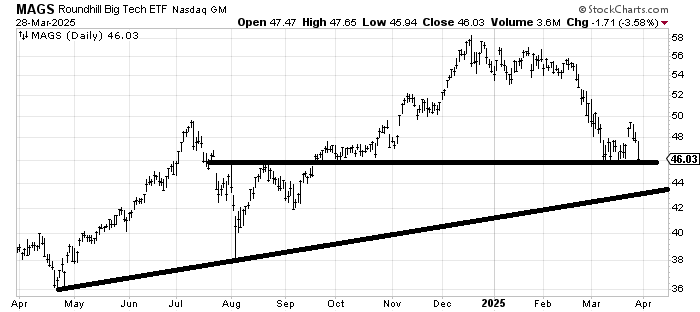
MAGS is like the QQQs with less volume and a lower price. The support at 46 is obvious. A plunge to 42-ish should be panicky enough for a trade. It would then leave a lot of resistance overhead in the 46-48 area.
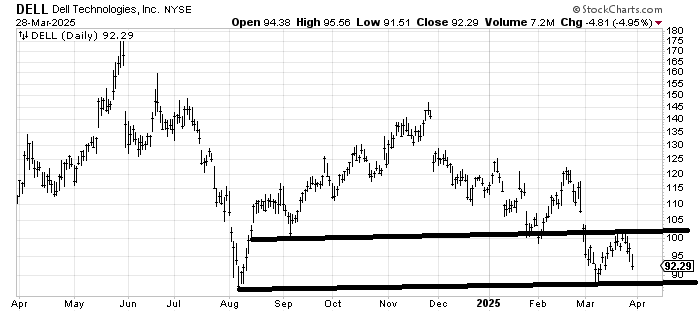
Dell DELL is a stock in a downtrend; the only good news is that it hasn’t made a lower low yet. A break of 90 with no panic measures longer term into the 60s.
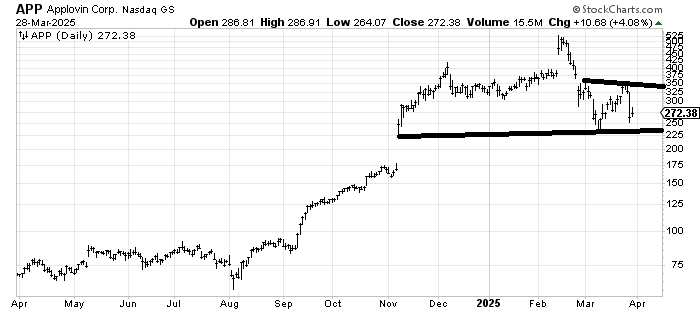
For all the hysteria over Applovin APP on Thursday, the stock had no follow-through selling on Friday. A rally from here that can’t get over 350 would tell me the next trip down, it breaks the lower line and, at the very least, fills that gap.
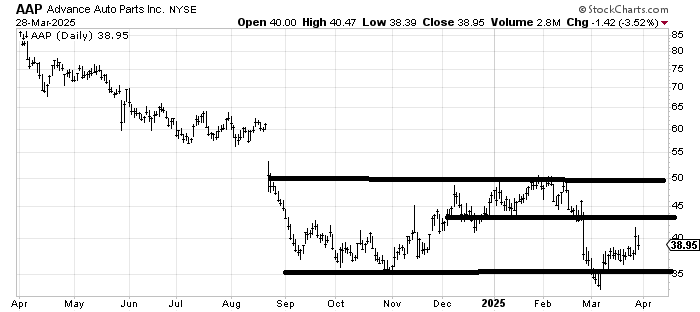
Advanced Auto Parts AAP is a good example of a chart that breaks a key level, perhaps not panicky but it was enough to then get a snapback rally. For the time being, I think it is in a trading range of about 35-45. Most of these down-and-out stocks have not set up for more than a trading rally over the last six months, and unless/until we get some panic in the market, that’s what I will continue to expect.
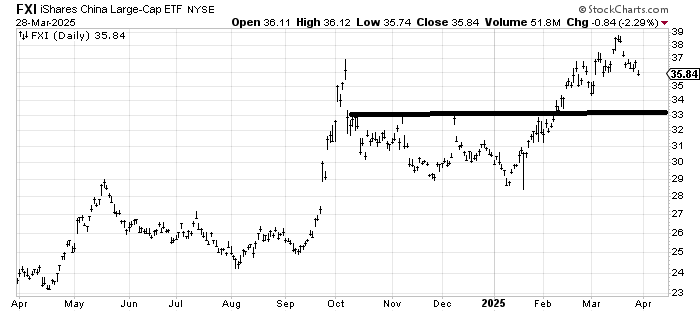
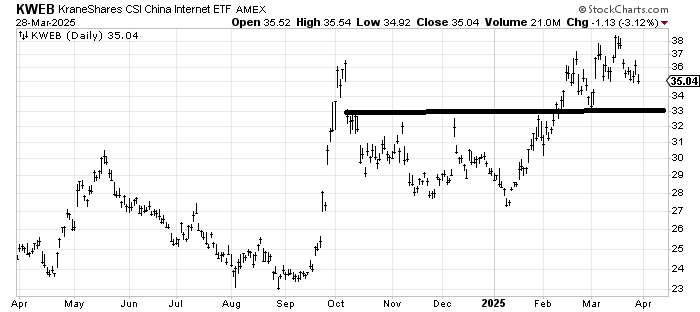
I keep waiting for FXI and KWEB to have a pullback toward 33. Oddly, they are both the same price. Yet, for the last six weeks, all we’ve seen is chop. But I’ll continue to look for that pullback.