Is Volume Getting Close to Becoming Oversold?
It's about time, but the volume indicator has finally moved.
You've reached your free article limit
You've read 0 of 1 free Pro articles.
The Market
So we got the bounce. Now let’s try and get a few down days, some choppiness, something to set us up.
I went through the math on the Overbought/Oversold Oscillator yesterday, so I won’t bore you with that again today. But I will give you some more math.
As you know, the McClellan Summation Index has been in a downtrend since last summer. It now needs a net differential of +800 advancers minus decliners on the NYSE to halt the decline. One good day of breadth can do it. My point is that if we can get to a good oversold condition, we might even get the Summation Index to line up with it.
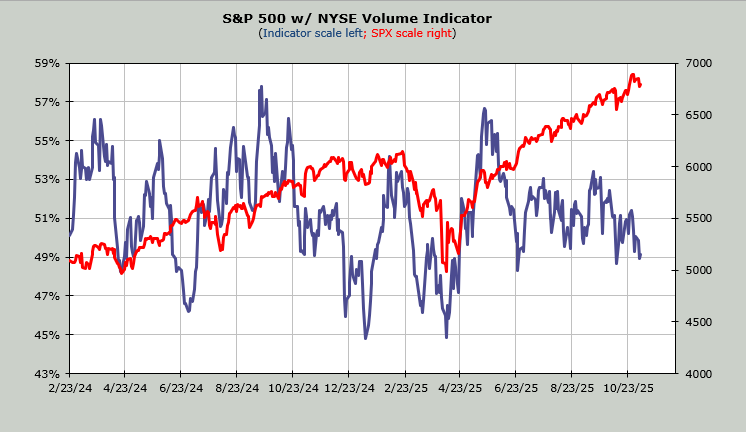
Then there is the Volume Indicator. For months on end, each week I show it to you, and it sits there at 50%, sometimes it’s 51%. Well, this week it slipped down to 49%. A reading in the mid to upper 40s makes it oversold. It is possible that this can reach a decent oversold condition for the first time in months.
My fear? It will not set up. Instead, we’ll have a sloppy rally before all these indicators set up, and that would mean another week or so of rallying, and then we’re back to overbought. Another week of group rotation, and then we’re done with that group, and we move on, etc.
My biggest challenge with seeing an upcoming oversold condition is sentiment. I simply do not think it is anywhere close to bearish. That’s another reason a bit more downside would help.
New Ideas
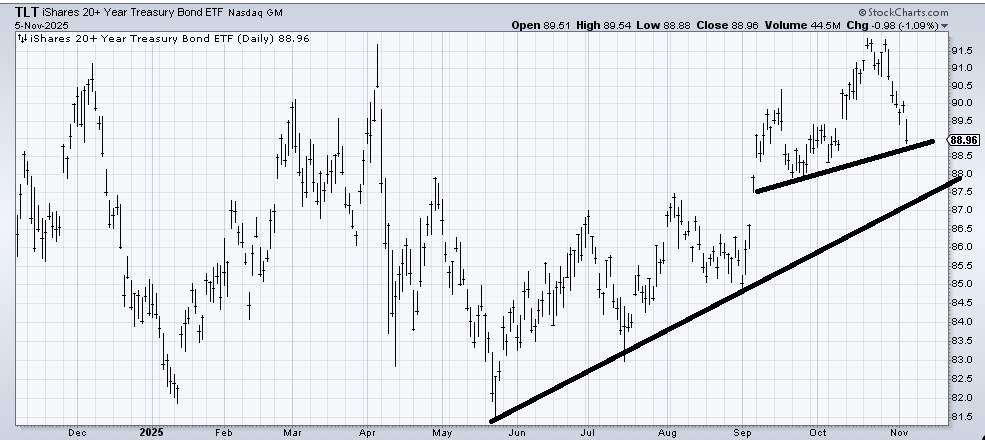
Let’s revisit the chart of (TLT) because you may recall I thought that 92 was the upper end of that rally off the spring low. TLT has come down quite a bit in the last few weeks and now sits at some light support. I would look for a short-term rally in the next few days. Right now, my expectation is that the 87-88 area does not get violated.
Today’s Indicator
The Volume Indicator is discussed in full above, along with the chart.
Q&A/Reader’s Feedback
Helene welcomes your questions about Top Stocks and her charting strategy and techniques. Please send an email directly to Helene with your questions. However, please remember that TheStreet.com Top Stocks is not intended to provide personalized investment advice. Email Helene here.
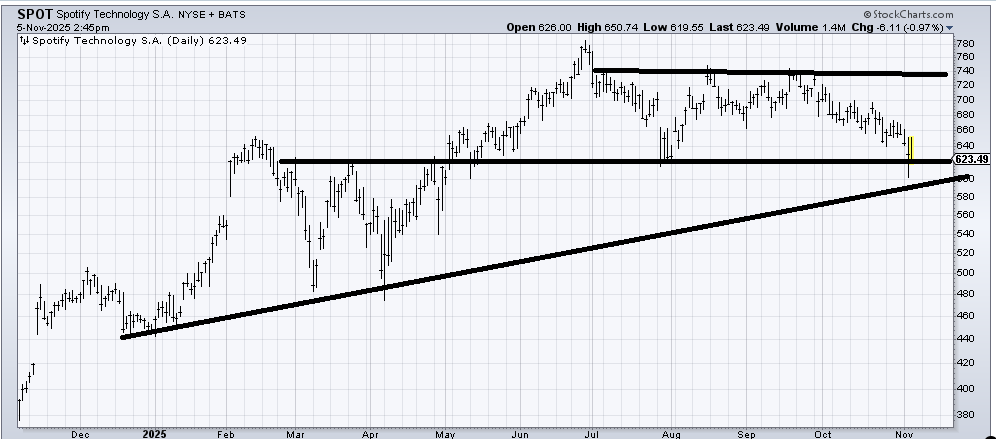
Spotify (SPOT) looks like a top to me. But unless/until it breaks under 600-ish, it gets a chance to get saved.
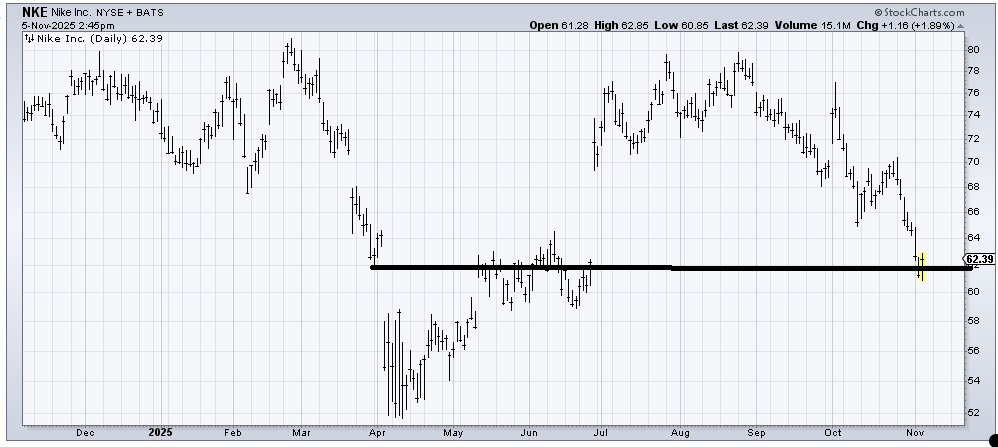
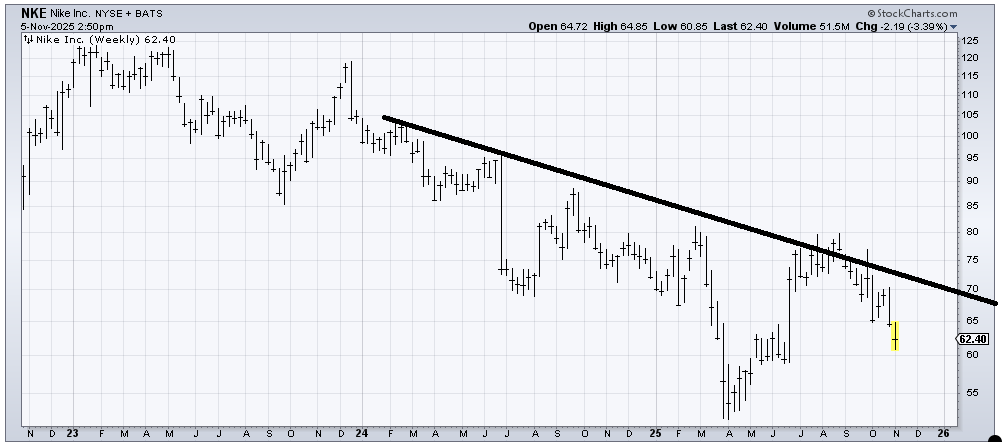
When we looked at Nike (NKE) a few weeks ago, I said the chart looked ugly (it still does), but I noted that a gap fill would make it interesting. However, more so, I honed in on the weekly chart (3 years) and drew in a potential (very funky) head and shoulders bottom that might develop to make this a decent stock for 2026. I still feel that way. Short term, it’s oversold, but I want to see what the stock does into year-end to see if it can develop a pattern that makes it interesting for 2026.
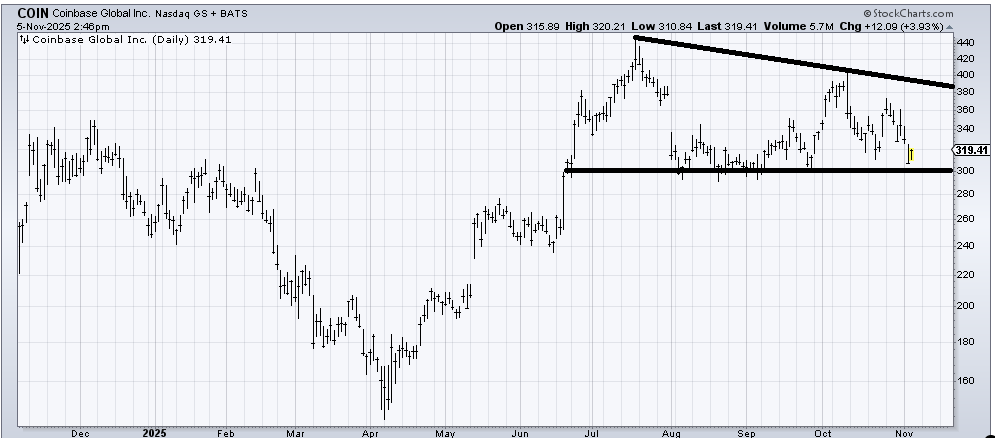
Coinbase (COIN) has decent support at 300, but I always prefer to see a pattern develop before buying it. We’ve had some good success waiting for that pattern to set up. If you prefer to not wait, then just use a stop under 300-ish. Notice how it took two months of back and forth (August and September) before we had what I considered a good setup for a rally. That’s just my own preference.