Is There More Work to Be Done on the Downside Before We Rally?
Friday's late day rally was a good sign, but there are other factors to consider.
You've reached your free article limit
You've read 0 of 1 free Pro articles.
The Market
I did not love that late Friday afternoon rally. Yes, I know many will say, but we got hammers on a lot of stocks (when a stock is down a lot intraday and reverses to close at the highs), which is bullish. But for me, there are other factors at work.
First, sentiment. Most of the sentiment indicators I use are not short-term (more on that later). Thus, it takes more than a few down days to really change sentiment. So that means the various moving averages of the put/call (or call/put) ratios haven’t had enough time to get into place. The various surveys usually need more than a few days to change their respondents’ minds. The VIX was trying to get jumpy, but it still feels incomplete to me—and yes, this is very subjective.
Would a few more days have done it? Probably not, but a few more days would get the VIX jumpy. A few more days would get the put/call ratio to be in the 90s or over 1.0 for more than a day, thus pushing the ten-day moving average upward.
Also, let me say that on an intermediate-term basis, the issues are still there. Such as sentiment for most indicators having reached giddy two weeks ago, so now maybe they have backed off to complacency. But also, the 30-day moving average of the advance/decline line is not oversold.
Yet, here’s the good news. We were heading toward an oversold (short-term) condition, so even if there is no follow-through to Friday’s late-day rally, I still think we’re heading toward a rally this coming week. The VIX’s put/call ratio spiked to 1.04, which means the (mostly) pros who trade it are betting on a lower VIX. We want to be on their side.
The total put/call ratio jumped to 1.08, which is the highest since April. The put/call ratio for ETFs skyrocketed to 1.73, which is quite high (On October 30th it was .81, so that’s quite a change in sentiment in that respect).
Finally, if we use a thick pencil, the line on the S&P and QQQ charts did not break. If we use a thin pencil, it did. So if we come back down early this week, we should still get a setup for a short-term oversold rally. And if there is no follow-through back over those lines, folks are going to get much more cautious.
In sum, I don’t know if there will be follow-through from Friday’s late-day rally, but I do think if we come back down, we will rally again later this week. On an intermediate-term basis, the market is still not in great shape, but we’re just trying to play the swings for now.
New Ideas
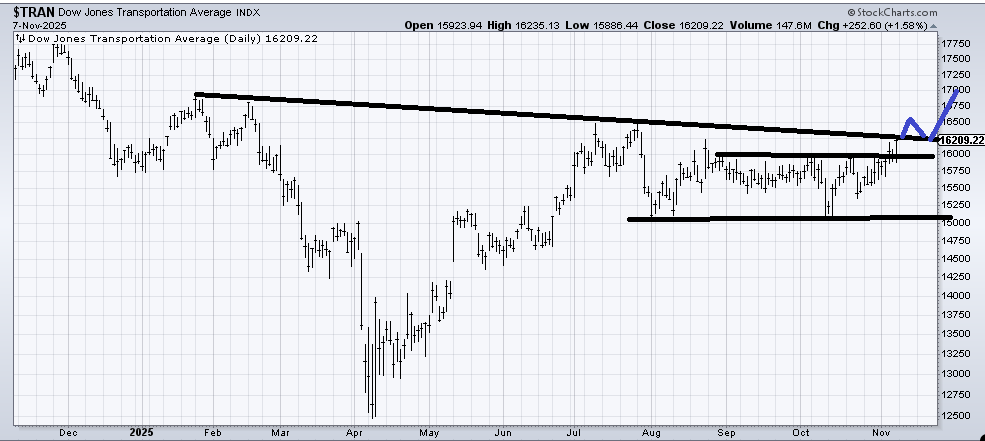
Two months ago, well, okay, maybe it was six weeks ago, I harped away at the Transports. I kept thinking they were shaping up. That was early October. Then the Transports went whoosh and proved me wrong. But since that whoosh, they have rallied eight percent! I’d love to see them cross that line around 16300, get stopped around 16500, and then pull back before rallying again.
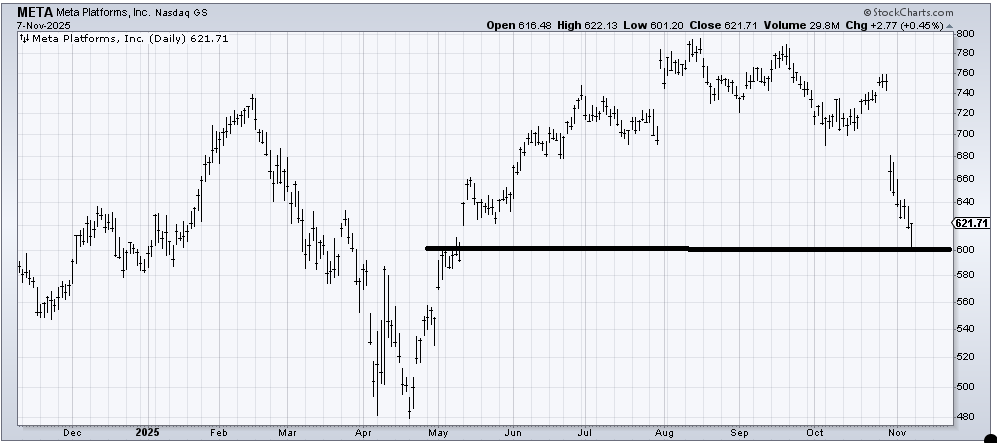
Just a reminder that when we looked at Meta (META) last week, I had said that a gap fill should produce a rally, and we got the gap filled on Friday. It’s a terrible chart now, but it ought to rally for a trade since it is so oversold now.
Today’s Indicator
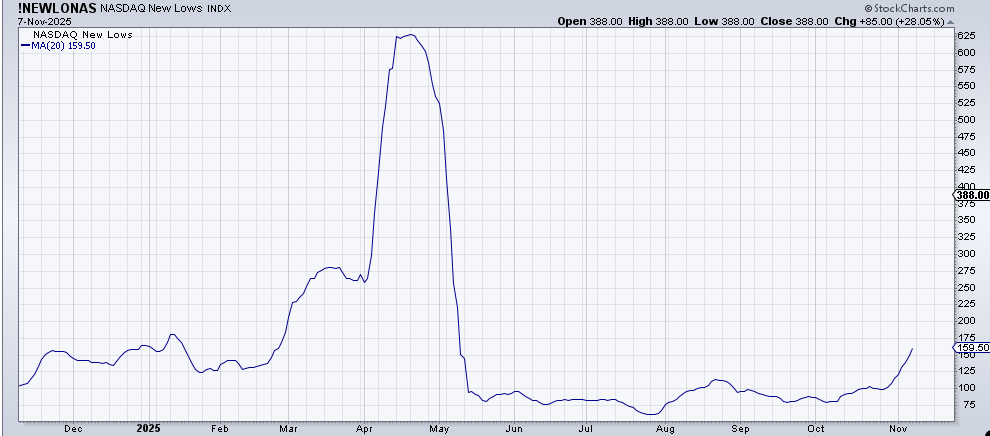
The new lows on the NYSE contracted a bit, but on the Nasdaq, they expanded. The 20-day moving average is now the highest since April/May. I expect this will peak in the next week, but overall will start ratcheting higher as we head into year-end (tax loss selling).
Q&A/Reader’s Feedback
Helene welcomes your questions about Top Stocks and her charting strategy and techniques. Please send an email directly to Helene with your questions. However, please remember that TheStreet.com Top Stocks is not intended to provide personalized investment advice. Email Helene here.
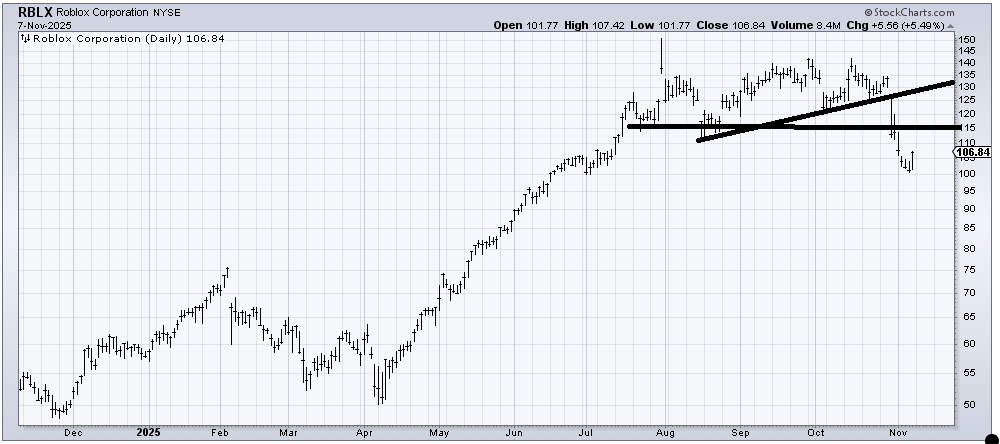
Roblox (RBLX) met its downside target when it tagged 100 late last week and is (obviously) oversold enough to rally. On the first attempt, I think 115 is going to be the area it stops. If it then comes back down to form some sort of W, then I’d look at it again. For now, I’d start with baby steps since it seems so many of these charts don’t recover all the way anymore. On one other note: see how it peaked last summer? That’s what I mean when I say so many stocks peaked in the summer.
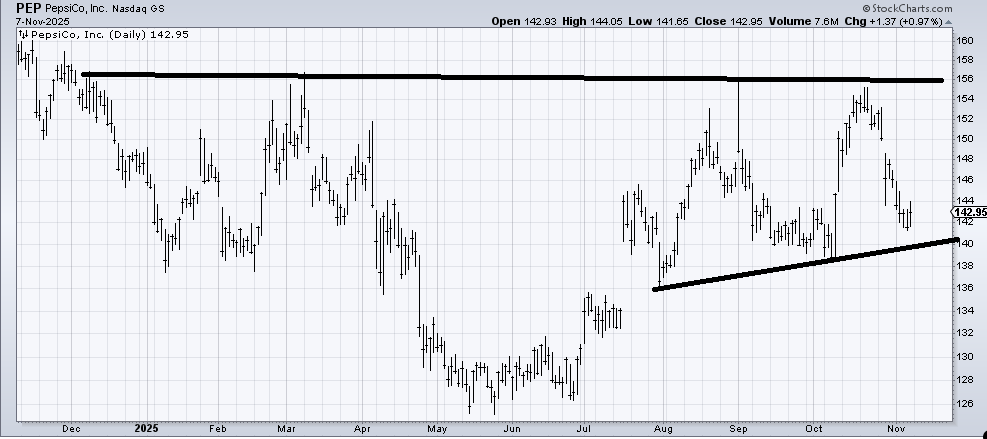
I still think Pepsi (PEP) is forming a base. I suspect it will come down and tag that line at some point in the next month. So maybe a rally now to 146-148 and then back down. It’s the kind of chart that doesn’t tend to make V bottoms.
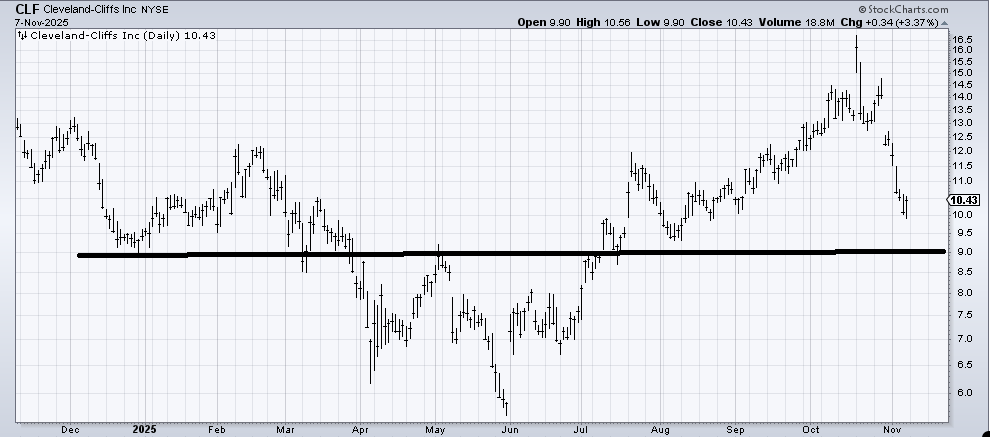
Cleveland-Cliffs (CLF) is oversold enough to bounce, but right now, that’s all I see is a bounce since the stock is down 60% in a few weeks. If it is going to repair itself, it will take time—just consider how many are now underwater in it, that means rallies will probably get sold for now. First resistance is 11.50-12.
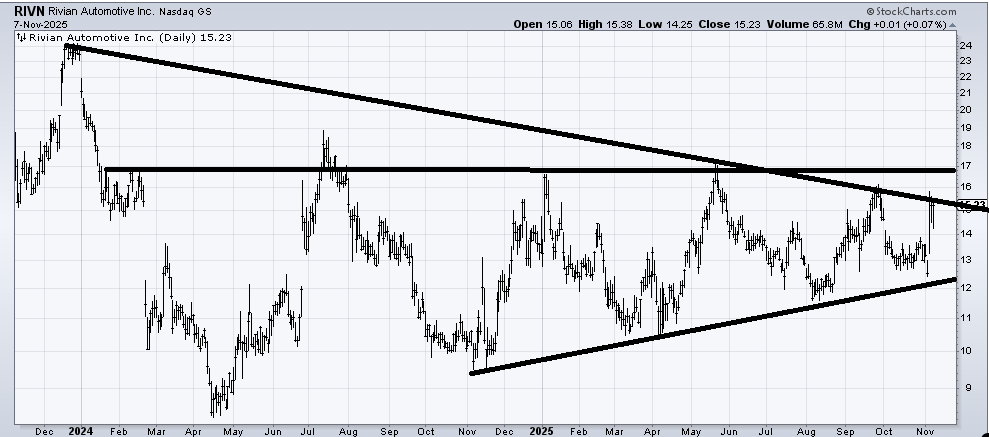
I have been staring at the chart of Rivian (RIVN) for months, thinking it is building a base. This is a two-year chart. The chart trades very spiky, so I have no idea what the short term brings, but get it up and over that 17-18 area, and that is a breakout from a long-term base.
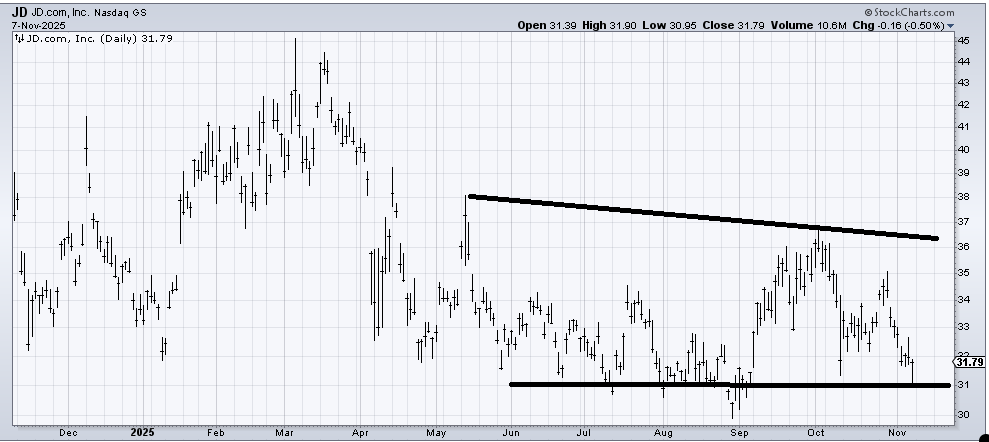
JD.com (JD) is oversold. There are no levels I would highlight on the upside because there is simply resistance all the way up. But as long as the stock stays over 30-ish, this ought to be basing action. It just might take a long time.
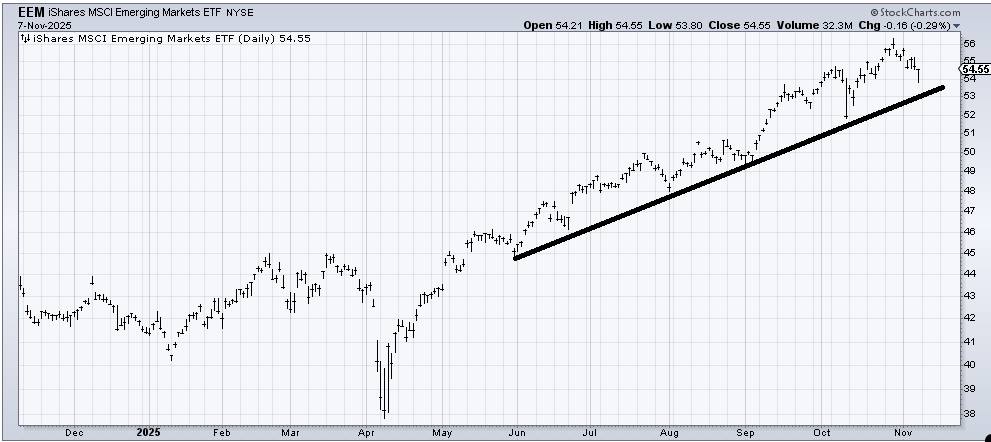
We entered 2025 with me liking some of the non-US markets. I did not recommend (EEM) (although clearly I should have!). It hasn’t done anything wrong yet. So as long as that line stays intact, it’s a hold to me. I am not comfortable buying up here, though.
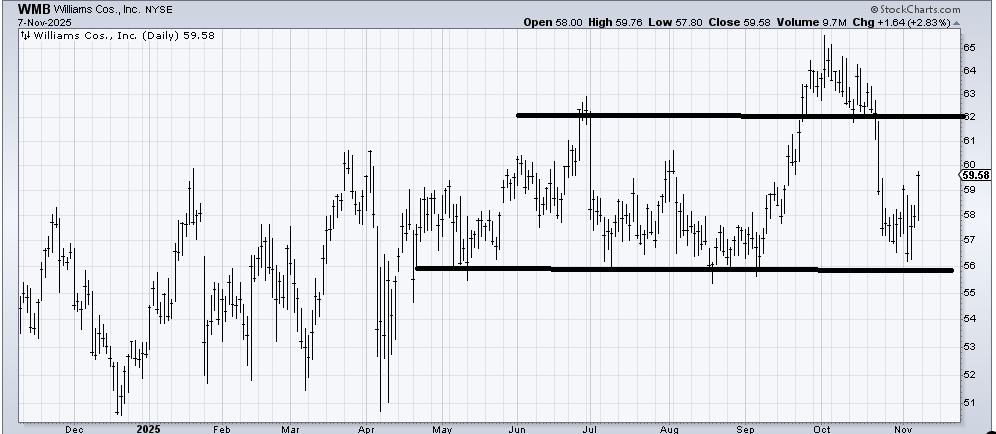
Williams (WMB) is a stock I have not looked at in years, and I see it is essentially the same price it was a year ago!. For now, I’ll call it trapped in a range between 56-62. Had it not had that big run up over 65 six weeks ago, I might like it more; now that looms as resistance. Note here is another chart that is down 15% in six weeks. This is what all those indicators/stats I keep citing is telling you: how bad it has been under the hood.
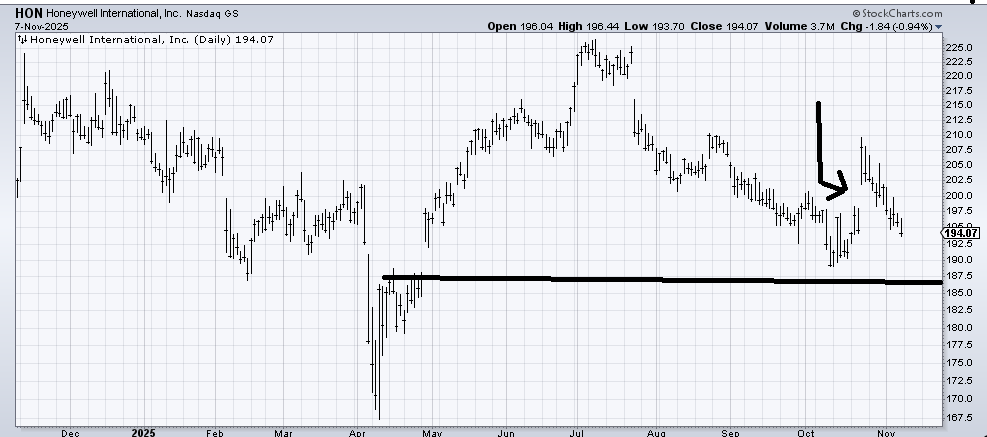
After Honeywell (HON) gapped up a few weeks ago, I had high hopes that it would come down, fill the gap, and look good. But it filled the gap and then slumped even more. I know there is an activist here and there are spin-offs, but as a pure chart, it does not act great. It’s got support in this 187-190 area, so if you want to pick at it this is the spot, but I am nonplussed by the action. Note when it peaked: July. So, yet another stock that peaked last summer. The list is long.
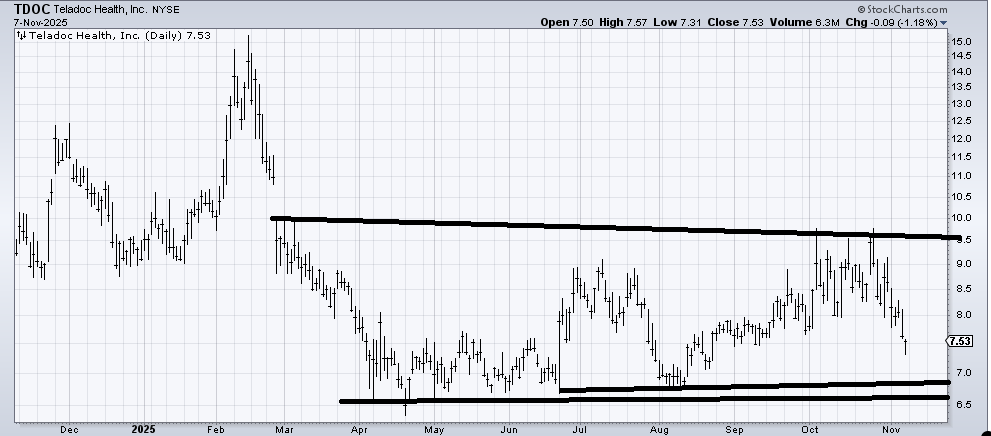
Teledoc Health (TDOC) is another terrible chart, but at least it’s trying to base. I suspect over the next several weeks we will see some tax loss selling in this name, but I would like to check back in on it in December to see if the base is fleshed out anymore. This may shape up for a 2026 play. For now, it’s oversold enough to rally, but that’s about all I see.
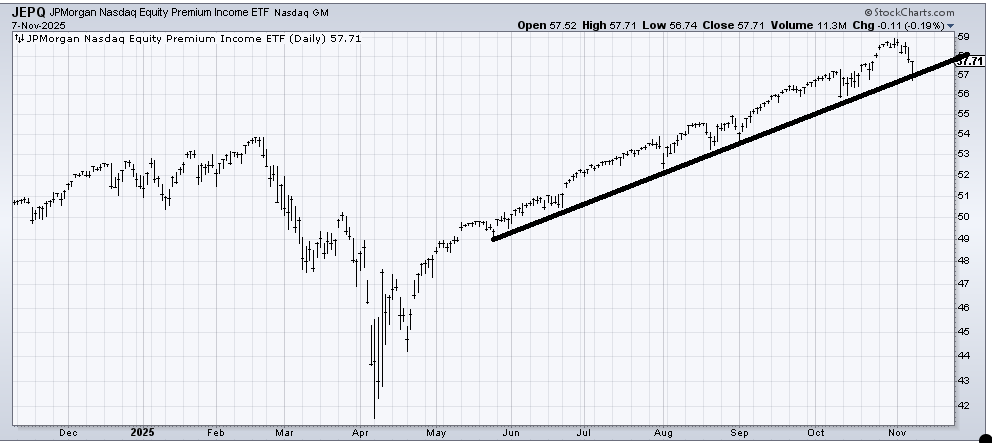
(JEPQ) is an ETF for Nasdaq Equity Premium Income, and it looks like just the chart of Nasdaq, so as long as that line stays intact, the chart is fine. I’d get quite cautious if that line breaks.
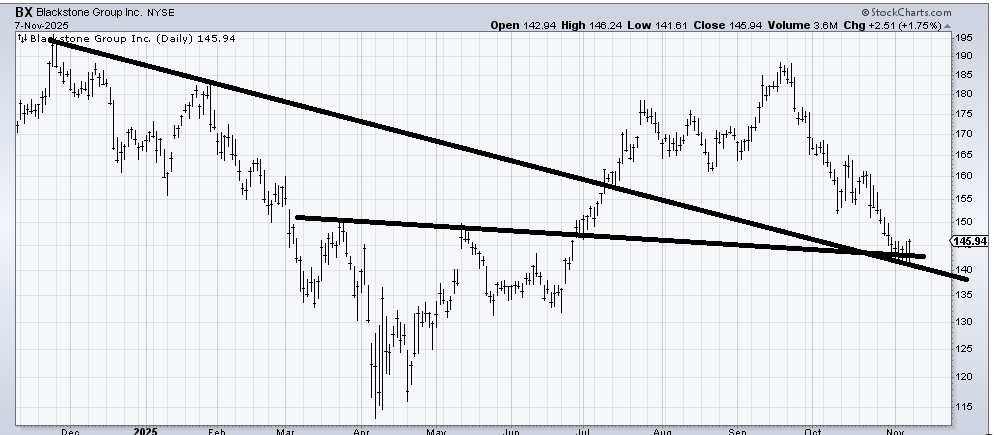
Blackstone (BX) is an interesting chart to me. It looks awful (always my favorite thing!) because it is now down 20% from its recent high. But that top it broke down from in October measured to 140-145. It has support here, so it really ought to try and rally. There will be layers of resistance all the way up, but as long as that 135-140 area holds, it’s an interesting place to nibble.
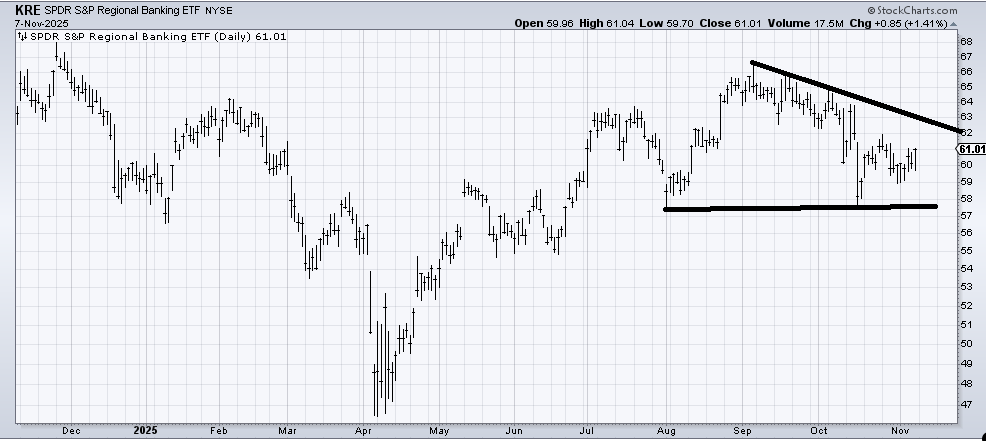
A follow-up on (KRE) , which I was asked about a week or so ago. It saw no selling last week. It ought to try and get to that upper line. If it can’t get through there, it will be bearish, but for now, I’m willing to give it the benefit of the doubt.