Is There a Flight Towards Quality Among Investors?
Let's look at breadth statistics and important ratios to see where the money is flowing.
You've reached your free article limit
You've read 0 of 1 free Pro articles.
The Market
Not much has changed. I still think the market has another rally left. I still think there is resistance overhead. I still think at some point we will head back down.
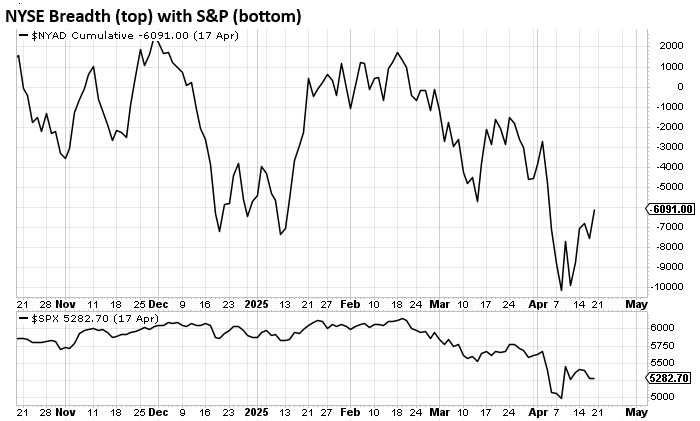
There has been a marked improvement in breadth in the last week. If we look at a chart of breadth vs the S&P, we can see it clearly. In the top panel, breadth has made a higher high (than that big turnaround Wednesday, April 9th) while in the bottom panel, we see it remains below that big rally day. That tells us much of last week’s retreat was in the index movers.
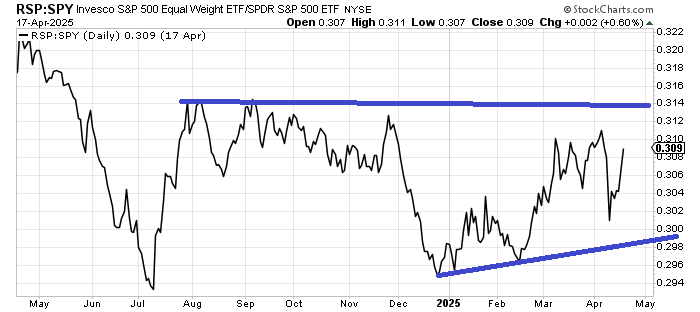
If we look at it a different way, the equal-weight S&P (RSP) has been outperforming the S&P since the calendar turned to 2025. I know it doesn’t feel that way, but the low in this ratio was made in the final days of December.
The ratio has yet to take out the early April high, and there is still ‘resistance’ overhead, but the story doesn’t change: this says the index movers are slowly falling out of favor.
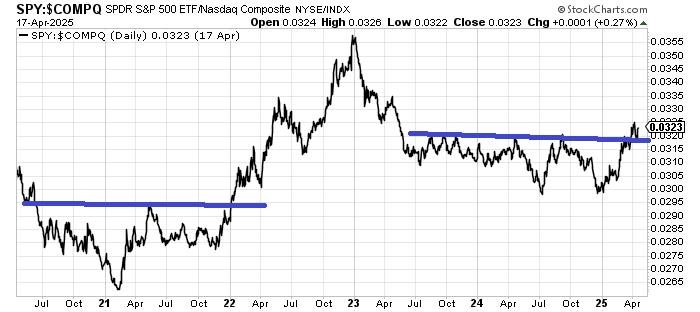
Finally, there is one other ratio chart we should look at. The ratio of SPY to Nasdaq. My view has typically been that when the S&P does better than the Nasdaq, it’s because there is a ‘flight to safety’.
Notice how the ratio broke out just as we entered 2022. Notice how it peaked just as we entered 2023 (the bear market low was in the fall of 2022). The trend in the ratio has been mostly down, and the ratio has not been able to make a higher high in nearly two years. When the ratio goes down or chugs along sideways, the index movers are in charge—or if you prefer, growth stocks outperform.
When the ratio is heading upward, people tend to shun growth and prefer value. You might have to squint to see it, but the ratio broke out to a higher high in early April.
None of these charts tells us what the market will do or whether it will be value or growth over the next few weeks, but rather, they show a trend where the index movers are no longer the only stocks folks want to own. Should these three charts turn south, we’ll be back in the Mag 7/Index mover market. However, thus far, 2025 has shaped up to be a market that moves away from them.
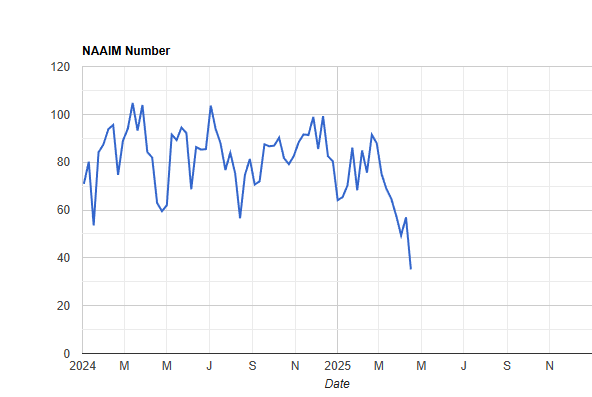
Away from that, the NAAIM Exposure number is now down to 35. I have wondered when it would fall, and it has. Of course, if we rally this week, it will probably tick up, but this was one of the hold-outs on the sentiment front, and now they have given up, or are giving up.
We’ll be overbought mid to late this week.
New Ideas
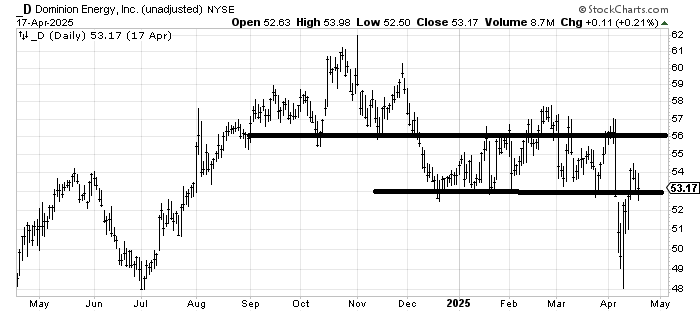
I’m going back to the high dividend-paying names. Today, we’ll look at Dominion Energy D. On the daily chart, it’s not great as that resistance overhead goes all the way up. Yet my affinity for spike lows is still with me, so I would be interested on any trip back down. But patience will be required.
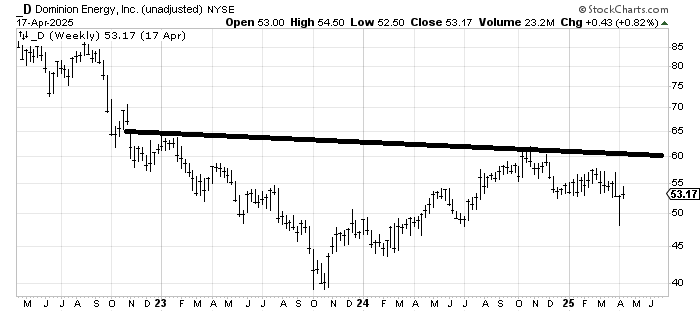
I’d like you to look at the weekly chart as well. That’s what basing looks like. But keep in mind each bar on this chart represents one full week of trading, so you can imagine how long it would take to finish developing the base (think months).
Today’s Indicator
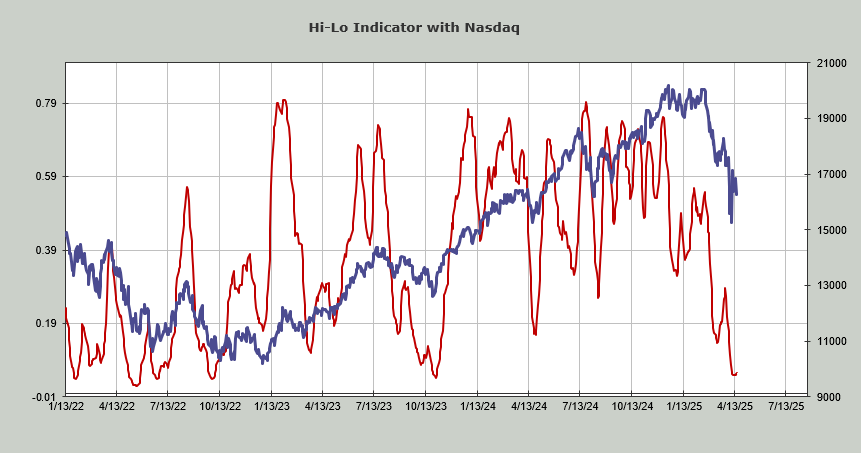
The Hi-Lo Indicator has not budged. That is rare, as usually it turns up when prices do. It remains oversold.
Q&A/Reader’s Feedback
Helene welcomes your questions about Top Stocks and her charting strategy and techniques. Please send an email directly to Helene with your questions. However, please remember that TheStreet.com Top Stocks is not intended to provide personalized investment advice. Email Helene here.
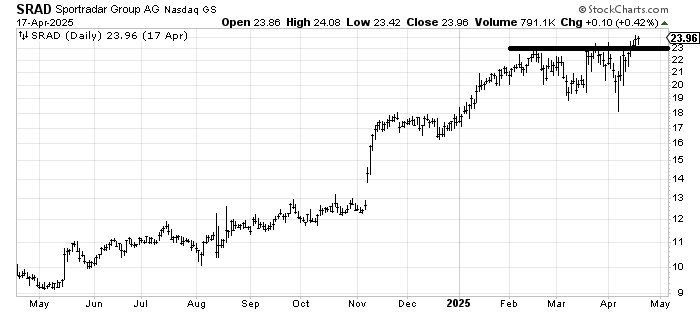
Sportradar SRAD is definitely a stock in an uptrend. As someone who struggles to chase it’s hard for me to jump on board a stock on the new high list in this market. There is a measured target in the 26-ish area. If the stock heads back under 22, I’d get concerned.
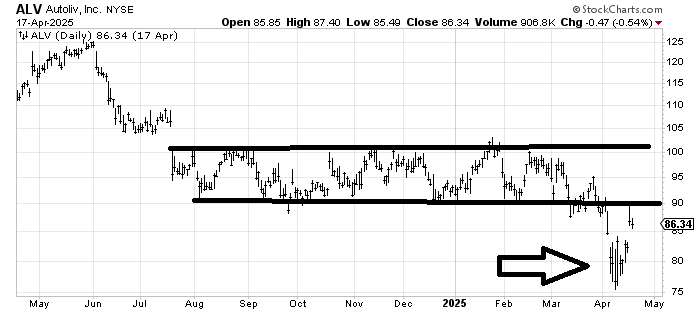
Autoliv ALV has so much resistance overhead starting at 90; it’s hard to get too excited over the chart. But that island down below (arrow) has me intrigued. If it fills that gap from last week (83-ish) then the resistance overhead matters a lot (i.e. it will take a long time to eat through it) if that gap does not get filled and the stock gets over 90 it will still take a while but less so because islands tend to be washouts.
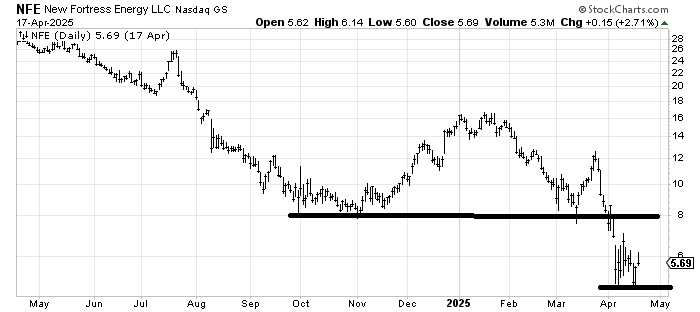
New Fortress Energy NFE with its big yield should probably go in that category, but it is a stock in a downtrend, so naturally, I fret that the dividend will be cut. For the time being, I would give it a chance to rally into that 7-8 area with a stop under 5.