Is the Winter of 2026 Starting to Look Like the Summer of 2024?
There are similar patterns emerging. Here's what happened next.
You've reached your free article limit
You've read 0 of 1 free Pro articles.
The Market
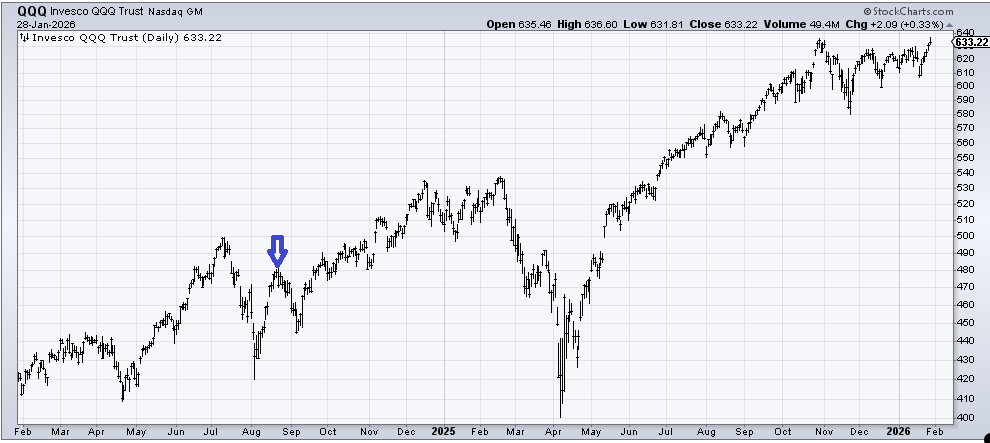
Well, at least the winning streak for the S&P ended. But it did not do so for Nasdaq, which has now clocked in six straight trading days of green. The last time it went to seven was mid-August of 2024. I’ll admit I was surprised when I saw what Nasdaq did thereafter. Shocked even. Here’s the chart of QQQ.
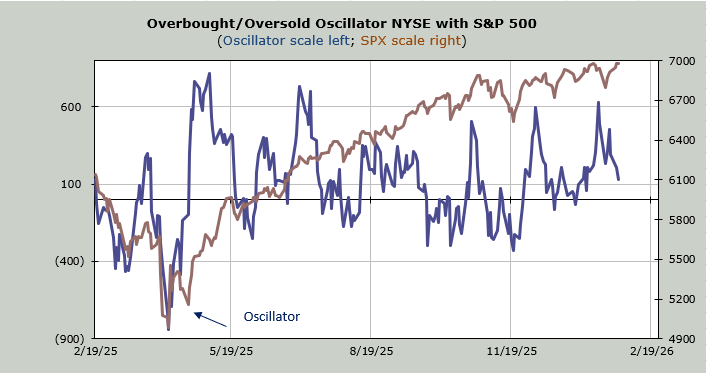
So while the S&P and Nasdaq, which by now we know are moved around by the handful of index movers, have been on a winning streak, the 493 have not been. The Russell 2000 has been red for three of the last four trading days. So at least we know my Overbought/Oversold Oscillator is doing its job on that part of the market. And we also know how hard it is for both to move at the same time.
The Oscillator is backing off, as you can see. It is trying to make its way down to an oversold reading. It’s still too soon for me to say when we might get there again.
But we do know that sentiment is getting a wee bit frothy. I hesitate to use the word giddy only because the Investors’ Intelligence bulls moved up to 61.5%, which is their first foray over 60% in more than a year. Yet the Bull/Bear ratio only pushed up to 3.99. Am I being fussy? Probably. I have said that when we have 4 to 1 bulls to bears (a ratio over 4.0) we have gotten to giddy.
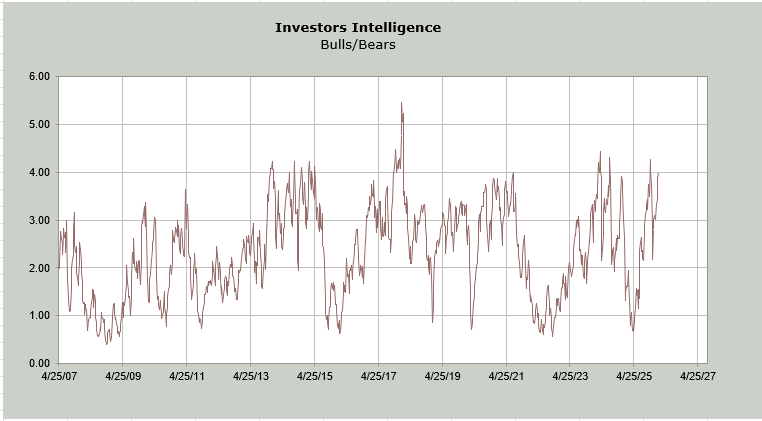
The last time this ratio got over 4.0 was the last week of October. We know what transpired in November. Prior to that, we have to go all the way back to July 2024. Wait, weren’t we just looking at the summer of 2024? Yes, see that chart above of the QQQs. There was that giant slide in July, the massive rally in August, and then another trip back down into early September.
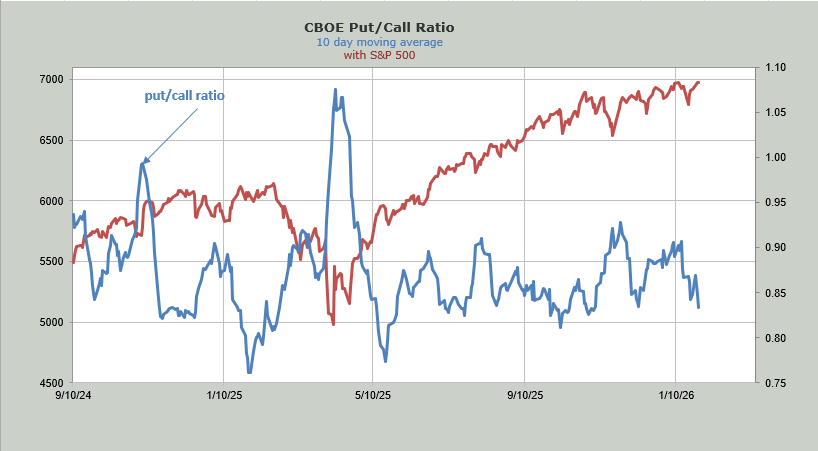
Finally, for the second day in a row, the put/call ratio was .74. Those sorts of low readings have been atypical. It puts the ten-day moving average at .83. It was .81 heading into the October high.
New Ideas
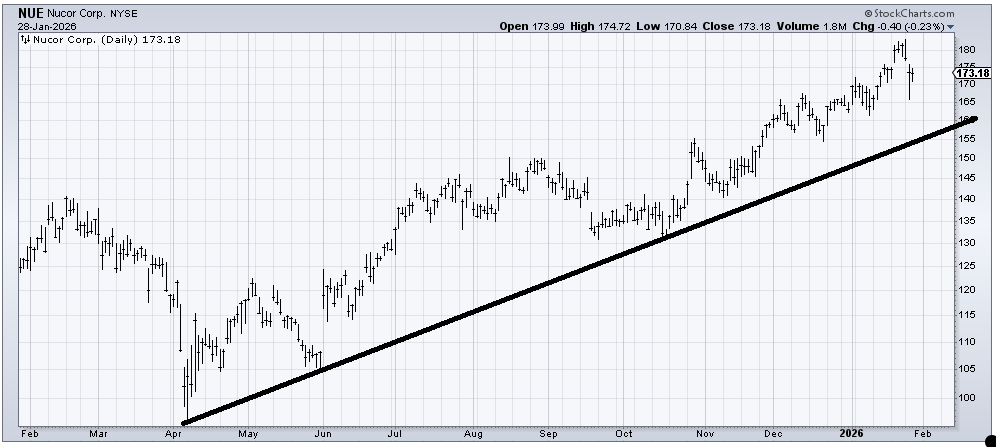
I was asked about Nucor (NUE) , which you might recall I have liked for a few months, but last week I noted there was a measured target at 180. It got there and now has pulled back. Typically, once a stock gets to a target, I would expect a pullback and quite a bit of work to be done as it either tries to regroup or builds a top (one never knows). My inclination is that this will regroup via correction and sideways action. I would love to see it meander back to that uptrend line over time before diving back in.
Today’s Indicator
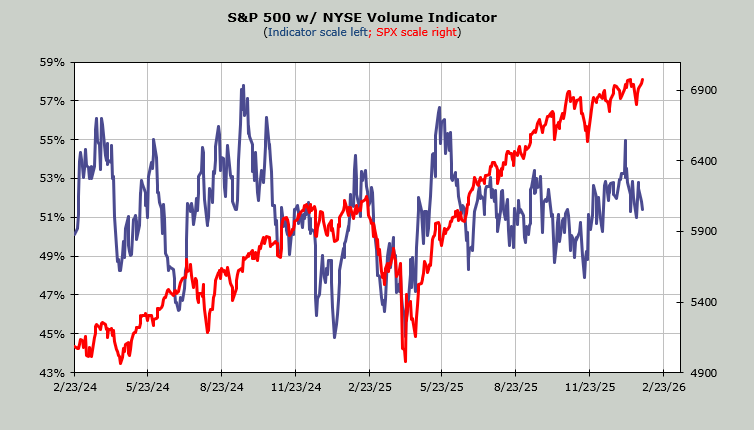
The Volume Indicator is still at 51%
Q&A/Reader’s Feedback
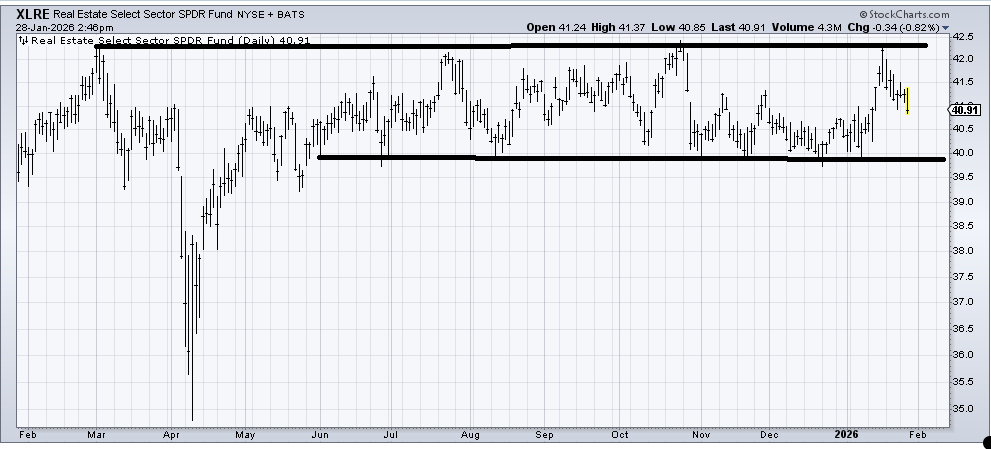
I am unsure how (XLRE) , an ETF to be long REITs, is different than IYR, but XLRE did not make a higher high a few weeks ago while IYR did. For now, XLRE is in a trading range, one it has been in for about a year (with the exception of falling out during the Tariff Tantrum. If this trip down to 40.50 can hold and not take a trip down to 40, then I’d be inclined to buy, believing it was going to breakout. A trip back down to 40 keeps the trading range alive.
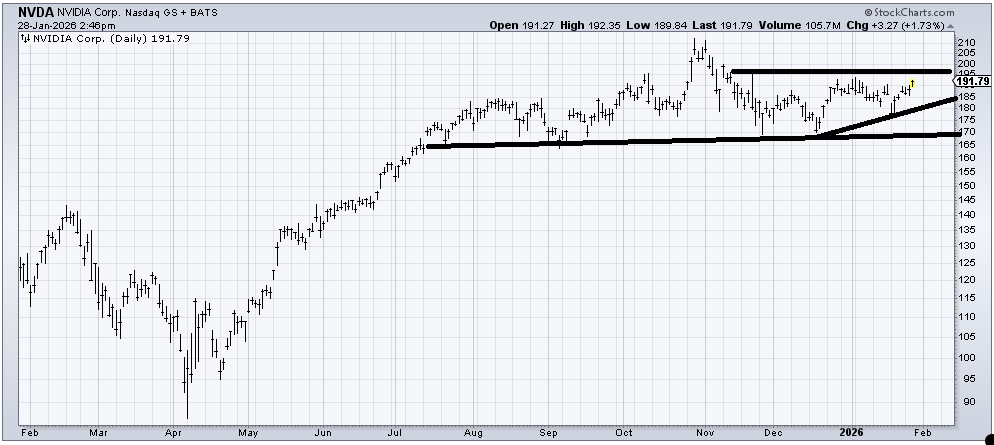
Back in December, when NVIDIA (NVDA) fell down to 170 I was a buyer. It has been rather mediocre in terms of the rally but unless/until it does something wrong, the stock looks like it is just meandering so I have to wait to see if it fails before I change my view. Over 200 would be bullish.
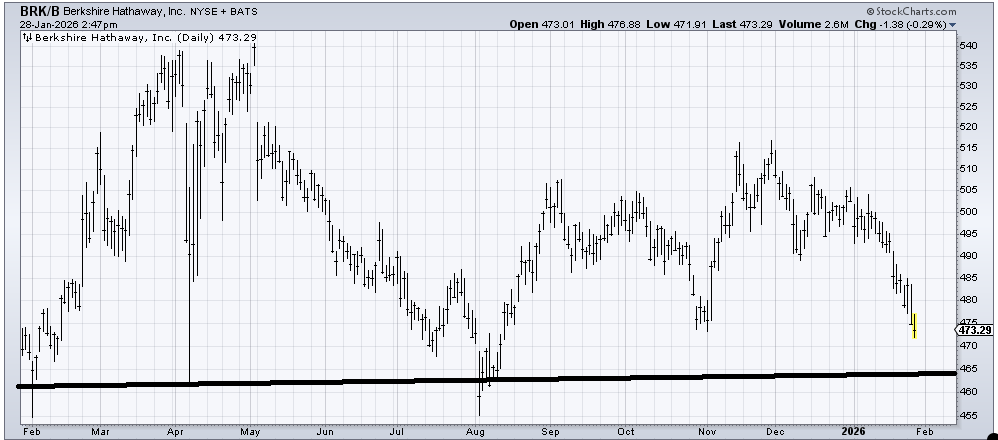
We have had a couple of decent trades in Berkshire Hathaway (BRK.B) in the last year, and now I see it is back near the bottom of the range. It is getting oversold, but I don’t have a strong view that it can rally well from here. I think it is oversold enough to rally, but that’s it. Now, if the chart can build a base, I’d be happy to call for more than a bounce. But not right now.
I was asked about Apple (AAPL) . Let me report I will not comment on it when earnings are out tomorrow. I did make a comment on it Sunday evening, so if you want to see how I viewed the chart as of Sunday, then please have a look there.
