Is Solana Getting Tired? Plus, a Look at Several Market Indicators.
Let's dive into the indicators to see what might happen next.
You've reached your free article limit
You've read 0 of 1 free Pro articles.
The Market
Today was exactly what you’d expect when two of the mega-cap tech stocks are up so much. You already know, when they rally, they tend to suck the money out of every other part of the market.
Yet let me report that despite seeing so much red on your screen today, breadth wasn’t terrible; it actually closed the day slightly positive. Very slightly. The McClellan Summation Index, however, continues to droop, and that includes Nasdaq’s.
For more than a month, the market has been doing this group rotation thing. First, it was drugs that got a boost. Then it was retailers, then it was a small rebound in software. Then it was energy. Nothing lasts (except the metals have been strong enough to have a trend). But mostly it has been like watching one of those big water bugs skitter hither and yon.
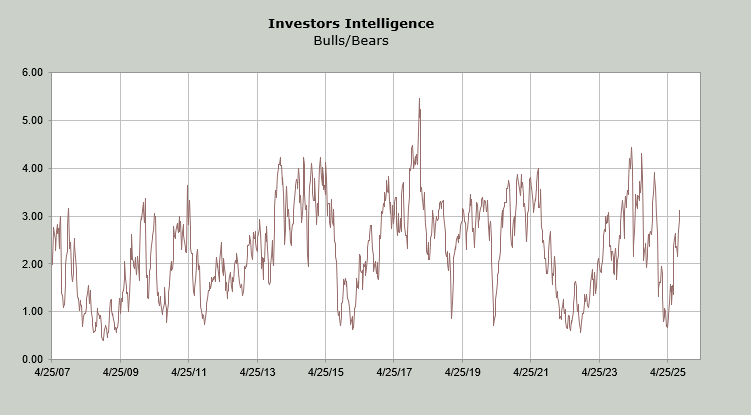
One thing I do want to note is that while sentiment is still what I would term complacent, we have seen a shift in the last month. The Investors’ Intelligence bulls are now 55% and the bears are 17.6%. The bears have not been teenagers since late last year. The bulls were higher (over 60%) last fall. But it is the spread between them that I am watching.
The bull/bear spread is now around 3.2, which means that it is the highest since late last year. Mostly, when this reading is over 3.0, I consider it high, but as you can see, it has tended to get a bit closer to 4.0, sometimes even over it, before it peaks (and usually the market does as well).
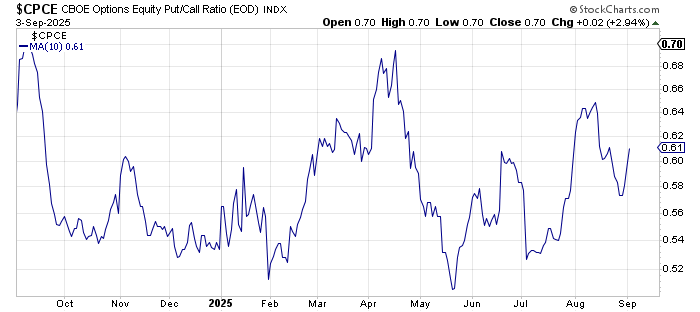
When it comes to the equity put/call ratio, the ten-day moving average is not only rising, but notice the moving average line troughed in May and has been making higher lows since.
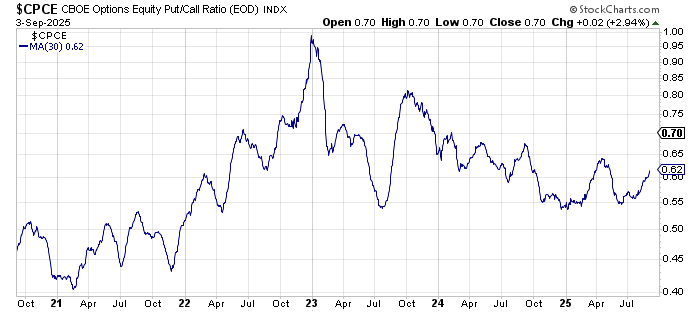
The 30-day moving average of the equity put/call ratio also seems to be bottoming in some fashion, refusing to make a lower low since June. So when I talk about complacency, this is what I mean. Giddy would have these at the lows; complacent is when they just sort of levitate as they are now.
Finally, let me note that as of this writing, the DSI has not yet been updated. Let’s assume with Gold’s action today, the DSI is probably now 88-90. And to top that off, CNBC chattered about it (finally!) today.
New Ideas
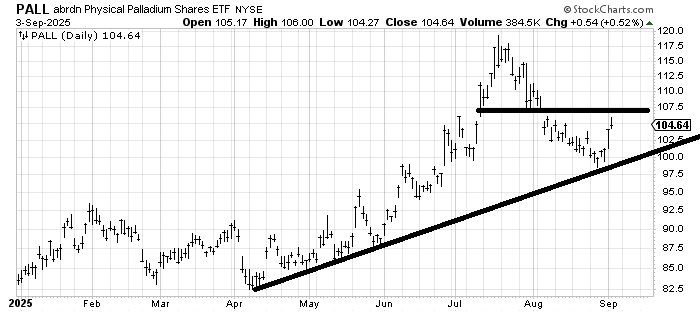
Earlier this week, I recommended PALL again. It has had a nice pop, but it is now at resistance. I would buy dips in it, especially if it got down into that 100-102 area,
Today’s Indicator
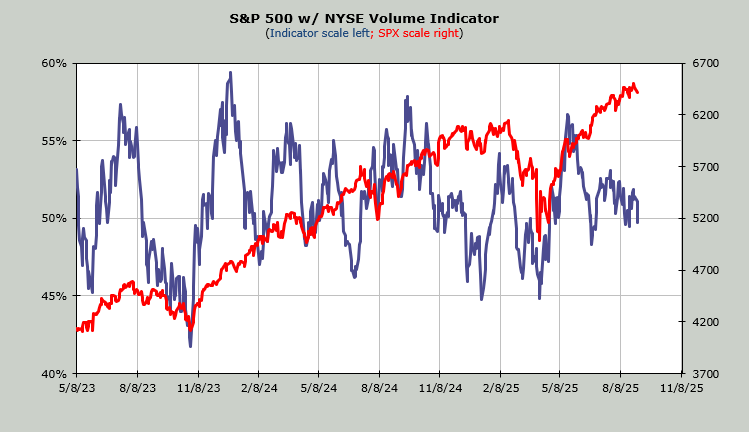
The Volume Indicator sits at 50%. I think I have said that for the last six weeks!
Q&A/Reader’s Feedback
Helene welcomes your questions about Top Stocks and her charting strategy and techniques. Please send an email directly to Helene with your questions. However, please remember that TheStreet.com Top Stocks is not intended to provide personalized investment advice. Email Helene here.
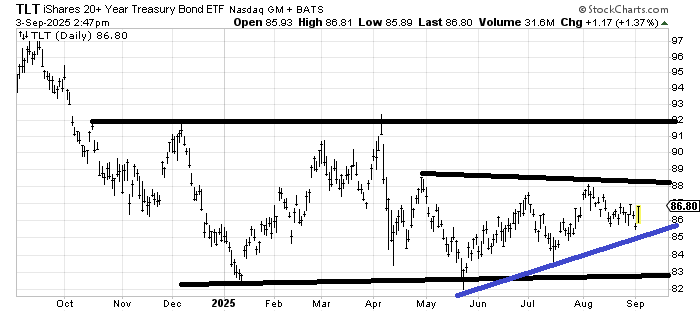
I have not changed my view on TLT. For months now, I have said I think bonds and, therefore, TLT is in a wide trading range, and thus far they have done nothing to change my view. If TLT broke that blue uptrend line, I might find myself more concerned, but mostly that big range from 83 to 92 remains in place for me.
Note, though, that doesn’t mean I think we can or should ignore bonds. If that blue line breaks, I think we should all get concerned.
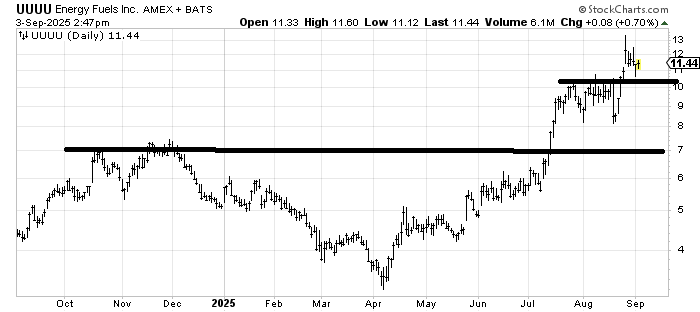
Energy Fuels UUUU hasn’t done anything wrong yet. It has hit its measured target area (11-12-ish), so maybe on a trading basis, you take something off the table here, but as long as that 10-ish support area holds, it ought to be a consolidation.
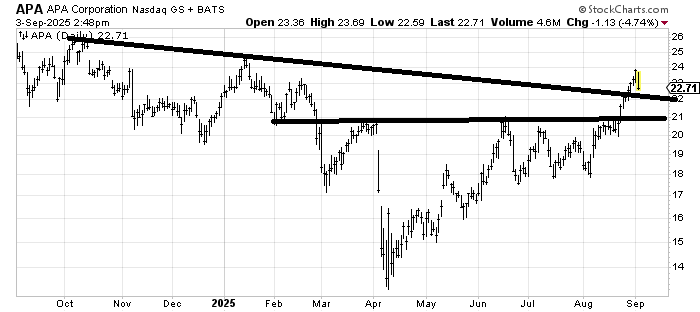
Apache/APA Corp APA had a little breakout over 22 and is now pulling back for a retest. Holding 22 would be more bullish, but I’d rather see it come back to 21-ish because that’s a flat line, not a slanted one. So, I’d be a buyer again around 21.
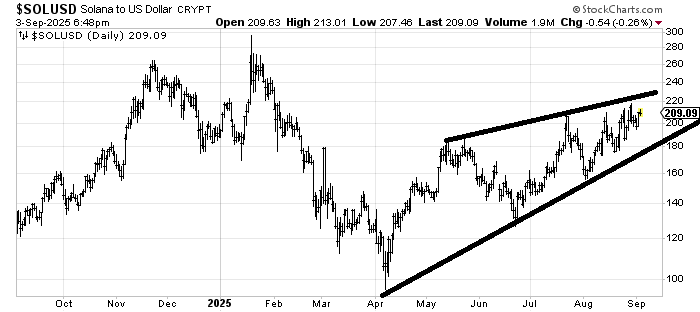
With the caveat that I am not a fan of anything crypto, the chart of Solana ~SOLUSD looks so typical of so many charts. A little upward bias but mostly a lot of, well, nothing. In the near term, those two lines should keep rallies contained and sell-offs contained. It just feels tired to me.