Is Low Volume Bullish or Bearish?
The market has gone sideways recently and investors seem to have started their summer break early.
You've reached your free article limit
You've read 0 of 1 free Pro articles.
The Market
The fact that the markets have seen volume slide this week brings up a great question: is low volume bearish?
Early in my career, I was taught that up days should see an increase in volume and down days should see a decrease. I suppose that worked for a while. But then I lived through the Crash of 1987, where volume surged to the highest we had ever seen (which incidentally was 602 million shares—can you imagine?—and the tape ran late!) and rallies thereafter never saw that kind of volume.
Then we had 2008, where the volume surged on the downside, and the rallies coming out of it in 2009 never saw big numbers. I changed my mind. Rallies do not need to come on high volume. I am, however, a stickler when it comes to the downside: in order to call it panic, we need to see high volume (recall all my calls for the QQQs to trade high volume).
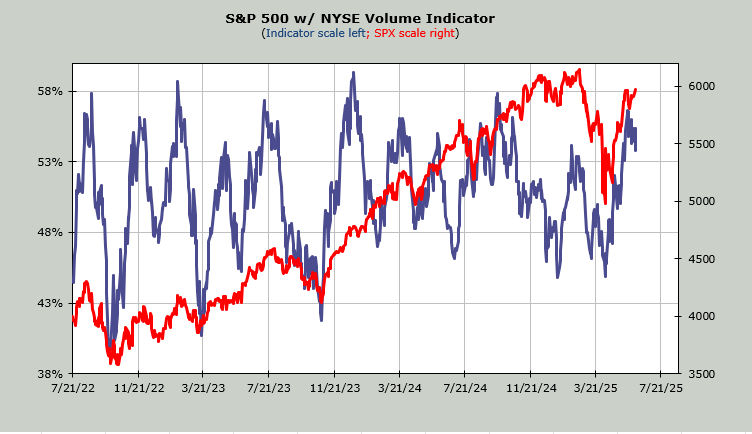
So, is the light volume bearish? No. It’s not bullish either. I do, however, have a view on Nasdaq’s volume relative to the NYSE. We looked at the chart here on Monday. It is rolling over. It might not mean anything in the next few days, but overall, these peaks in this volume relationship have meant we’re closer to a pullback than to a rally.
See how low it got in April? Look on the left side of the chart and see how low it got at the autumn lows in 2022. I would say this lends credence to my call that we will see a pickup in volatility coming our way in the next few weeks.
As for today’s action, or what little of it there was, nothing changed. We’re working off that short-term oversold condition, and we are still intermediate-term overbought.
New Ideas
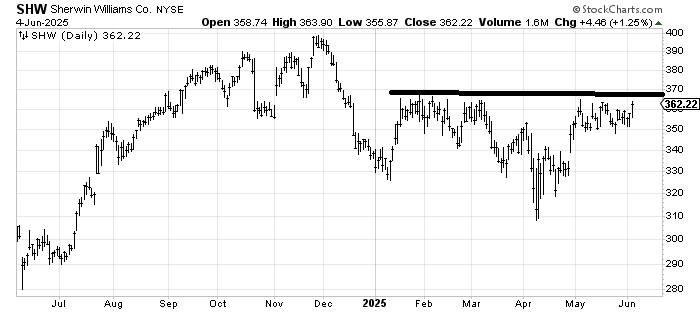
I have been looking for Sherwin-Williams SHW to rally for over a month now, and it has been a disappointment. Yet look at that chart, it doesn’t break 350, and maybe one day it will get over that 365-370 area.
Today’s Indicator
The Volume Indicator, which is different than the one discussed above, is still overbought at 54%.

Q&A/Reader’s Feedback
Helene welcomes your questions about Top Stocks and her charting strategy and techniques. Please send an email directly to Helene with your questions. However, please remember that TheStreet.com Top Stocks is not intended to provide personalized investment advice. Email Helene here.
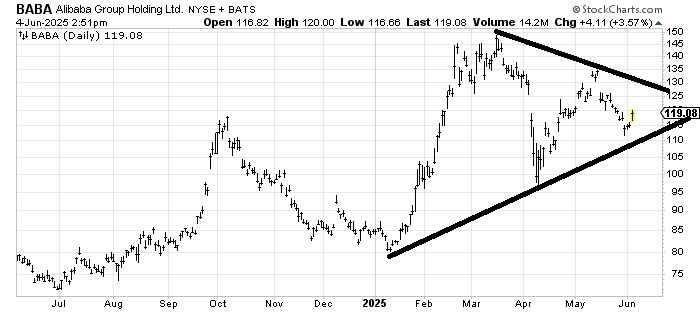
Alibaba BABA should make an attempt at the upper line around 130-135. I still haven’t decided if I think it can break out. Mostly, I think it is in a wide trading range.
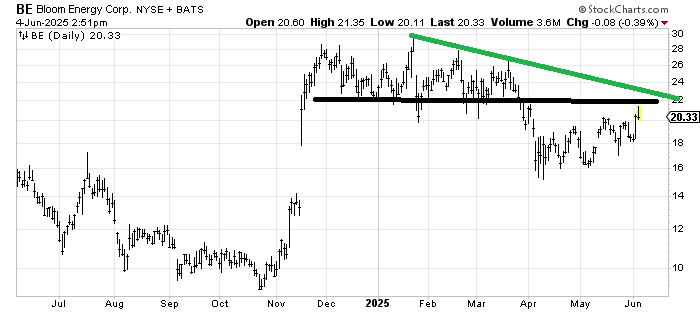
I think every time I am asked about Bloom Energy BE, I draw in this resistance line around 22. Even if it gets through there, it is just a mass of resistance all the way up to the top. So, either the black or the green line should stop a rally for the time being.
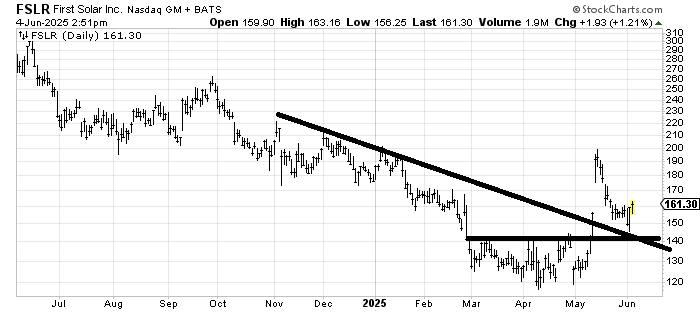
Last week, we looked at TAN, an ETF to be long solar stocks. First Solar (FSLR) has a very similar chart. It came down to support and is now rallying. I suspect 170-175 is short-term resistance, but overall, it is trying to make a bottom.
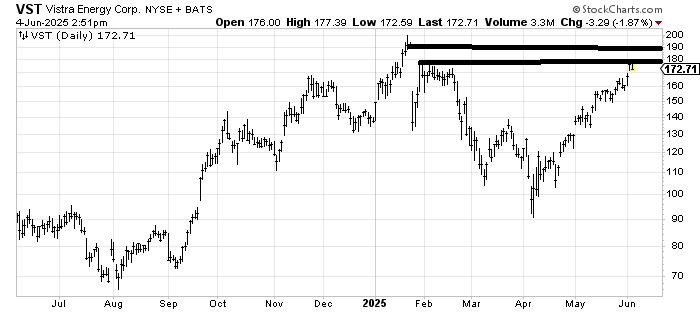
Vista Energy VST still has that resistance from the gap fill in the 180-190 area we have looked at several times already. It keeps trying to fill it. The chart wouldn’t get spoiled unless it breaks 150 (far away), so until then, it gets a chance.
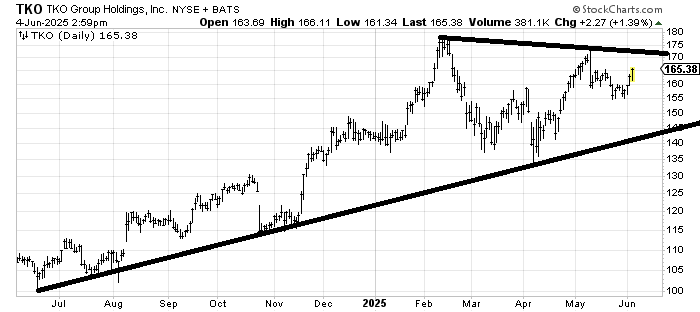
The first reason I like TKO TKO is because in the April whoosh, it did not make a lower low. There will be resistance in that 170 area, though, not just from the resistance line but because of that big swoop down from there in early May. But overall, with some work, maybe it gets up there, pulls back, and then rallies again.