Investors Remain Bullish, Expecting Gifts Next Week, Not Coal
Despite recent selling in the indexes, investors seem to place their hopes on a Santa Claus rally next week.
You've reached your free article limit
You've read 0 of 1 free Pro articles.
The Market
Well, that was not exactly a rally to write home about. Especially after we’d already had four down days this week. In fact, take a look at the Russell, and you will see that for the last four trading days, it has closed at the low of the day every day.
I don’t know if that means that much, but to me, I think it means folks are not keen to own the stocks overnight.
I still think even if we come down over the next few days, that we will be oversold enough by midweek next week to rally. But let me point out that the intermediate-term indicators are not oversold. It continues to be an up-and-down market.
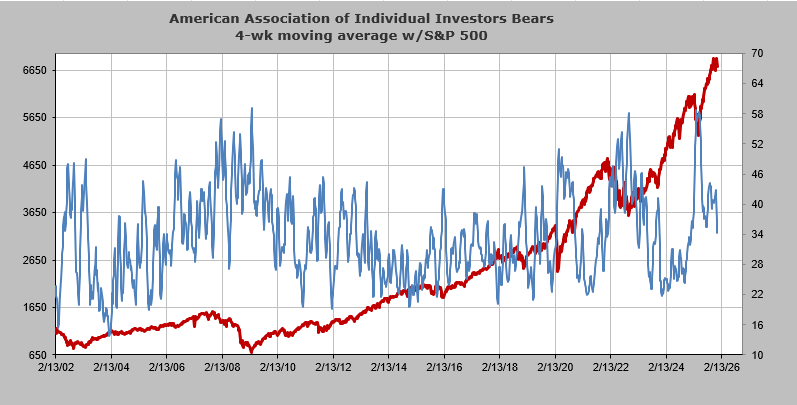
Sentiment, though, leans fairly bullish. The AAII folks who typically would turn bearish at the first downtick have not pulled in their horns at all in the last three weeks. Take a look at the four-week moving average of bears: at 34% it is the lowest since we came off that spring low. It amazes me that we have a market that has gone sideways for nearly three months now, and yet folks seem so wed to some sort of year-end rally that they refuse to give up.
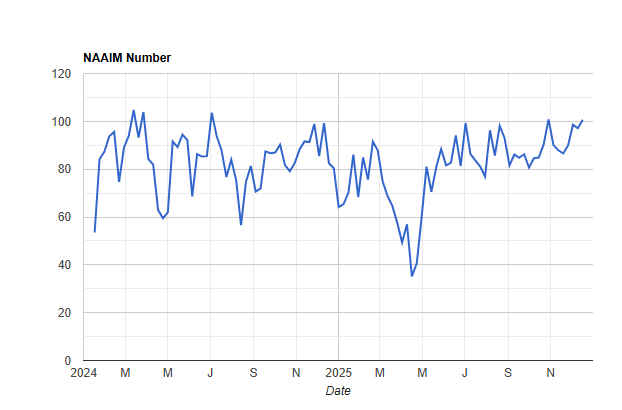
The NAAIM folks have gone on margin with their exposure creeping up over 100 for the first time since late October.
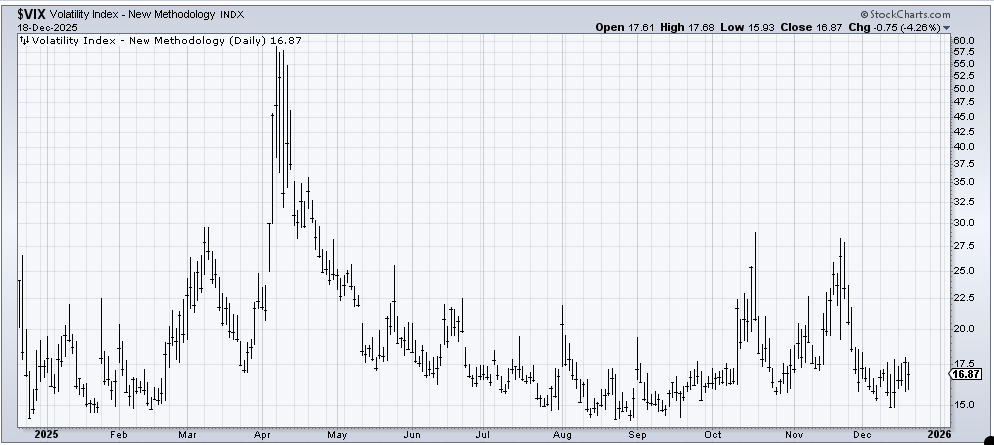
I’d like to see a down day on Friday, maybe get the VIX to rock and roll a bit. It just looks like it is bottoming again.
New Ideas
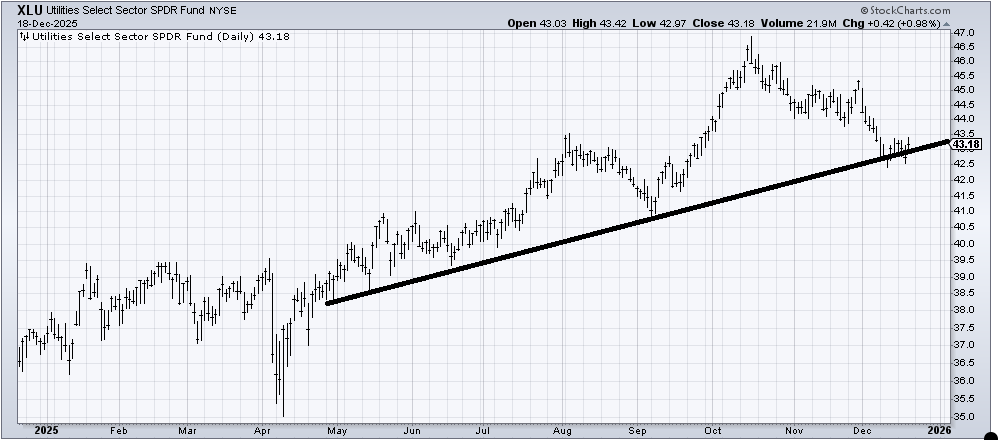
I want to go back to the Utes (XLU) because they continue to hang on to this support area at 43 by their fingernails. Yet I can’t stop thinking this is the area we want to own them.
Today’s Indicator
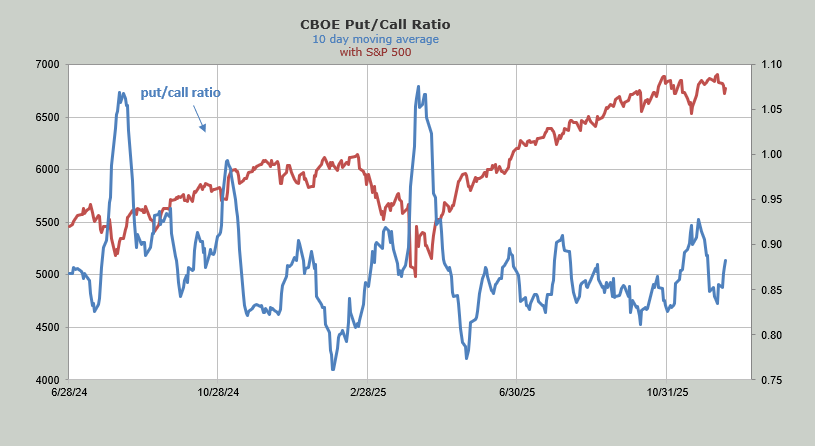
The ten-day moving average of the put/call ratio is moving up. But it does not show anything close to fear. Over .90 would get it closer.
Q&A/Reader’s Feedback
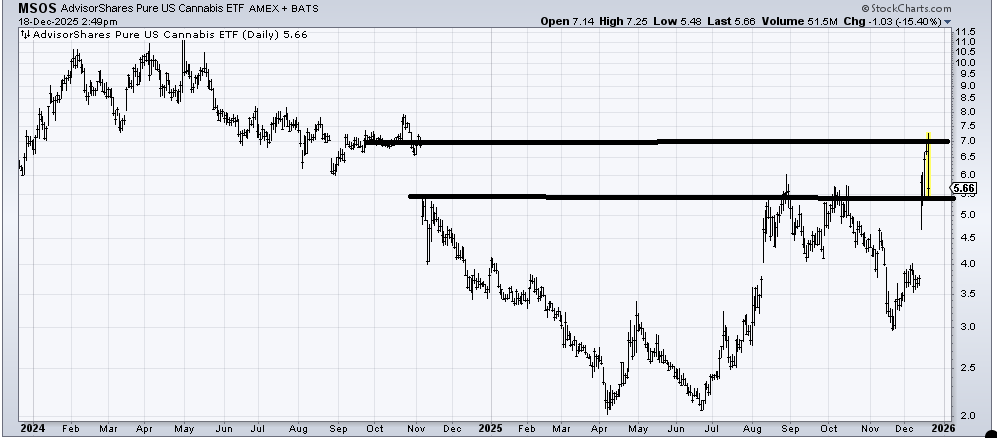
(MSOS) , an ETF to be long pot stocks, looks like the typical buy the rumor sell the news to me. But if it can hold this 5.50-ish area for a few days, I suspect it rallies again. However, I don’t think it will be able to just waltz through all that resistance that starts at 7 and goes up to 11. I have not been asked about the pot stocks in years, but they seem to be serial disappointers.
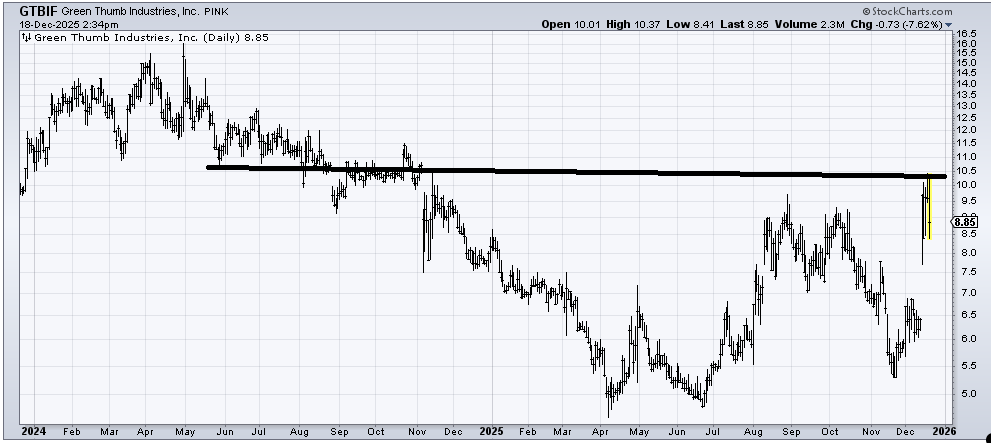
Green Thumb (GTBIF) has the same issue as MSOS: it ran smack into resistance as folks anticipated the news. If it can spend a few weeks/months going sideways between 8 and 10, then I would think some of that resistance has been eaten through. It’s not a bad chart, just looks as though folks bought the rumor.
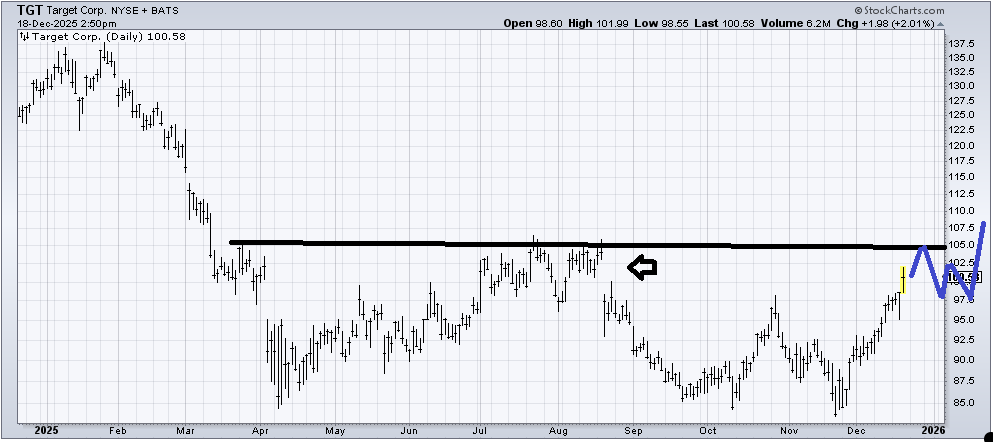
I was asked to follow up on Target (TGT) , which I have been positive on for a few months now. It just about filled that gap (arrow) and has a decent amount of resistance at 105, so if I were trading it, I’d look to take a little off the table here. Longer term, I have said I thought this stock would do better in 2026, and I still think so, but we should probably wait for a better setup, where it looks as if it can finally break over 105
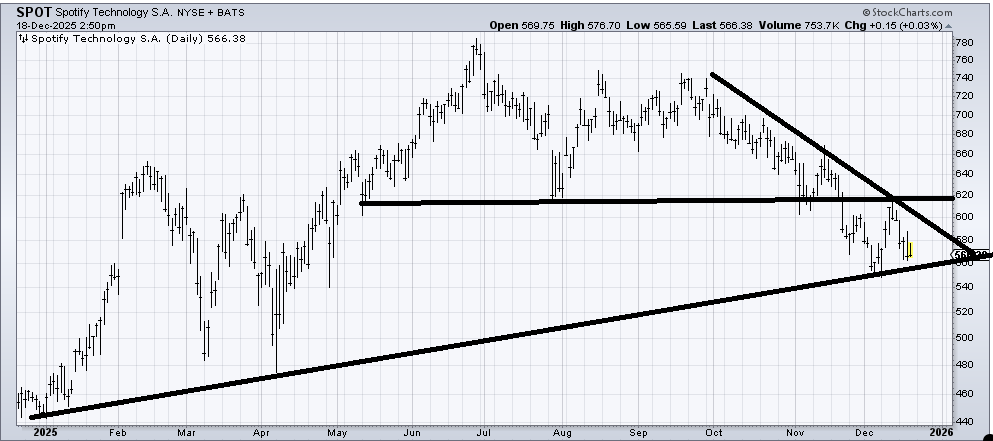
I would not be surprised to see Spotify (SPOT) rally one more time near the end of the year, but all of that resistance overhead is going to be tough to chew through. For now, I’ll call it a trading range between 550 and 620. I’d be a seller into a rally in that 600-620 area.
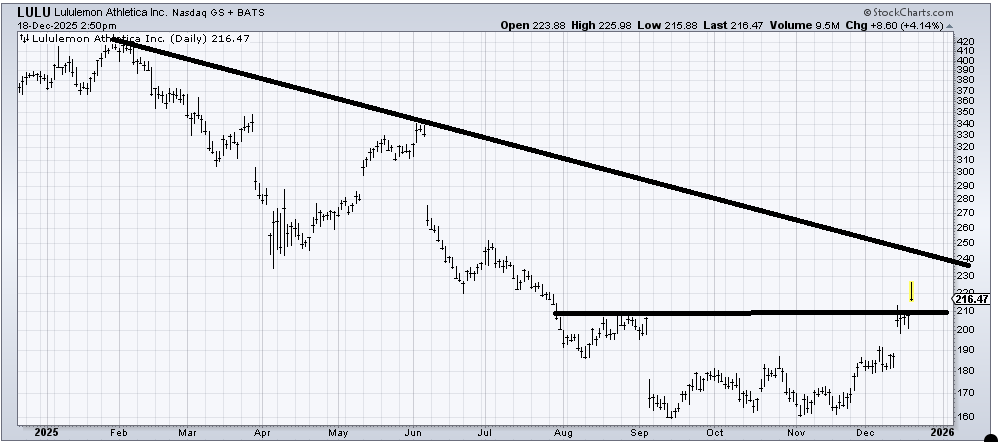
When we looked at Lululemon (LULU) in November, I had a positive comment to make on it. Now the question is if I think it will fill that gap at 310 before it fills the gap at 190. I don’t have a strong view on that, only because I think the gap at 310 is too far away to fill anytime soon. Right now, I would be concerned if it trades back under that 210 area because that tiny little base only measured to 210. Let’s see if it can hold 210 and bounce. I think that downtrend line (currently around 240) will be heavy resistance.
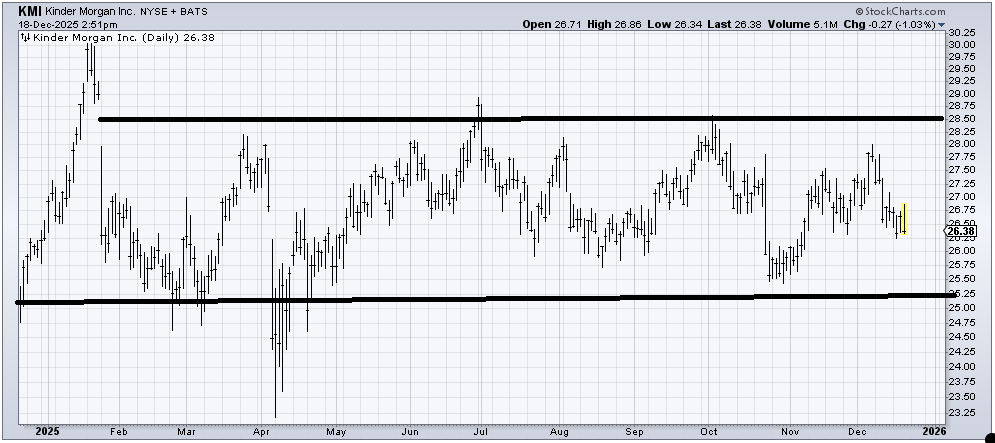
Kinder Morgan (KMI) looks like it’s in a giant trading range. It doesn’t look buyable or like it’s a sale. Just one giant range. I’d like to keep an eye on it because if it shapes up as buyable, that long sideways will be bullish.
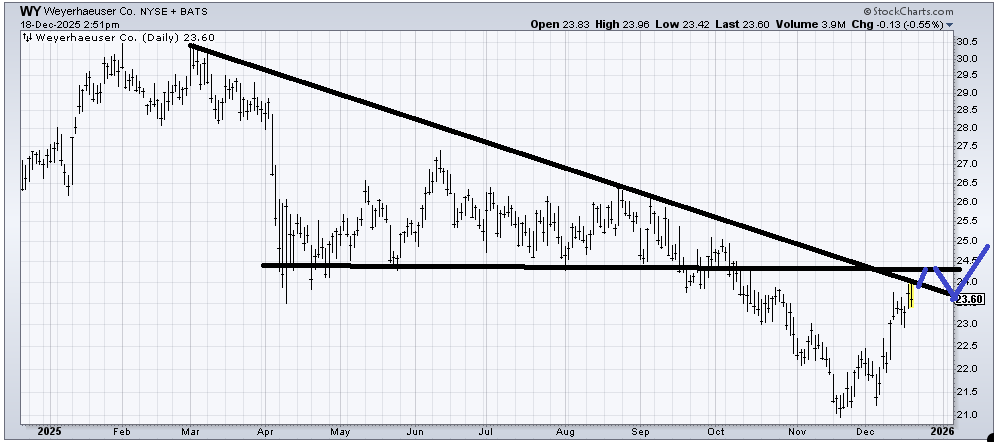
Weyerhaeuser (WY) has an awful lot of resistance starting here at 24 and all the way up to 27. I’d like to see it try and eat through something like I drew in blue.
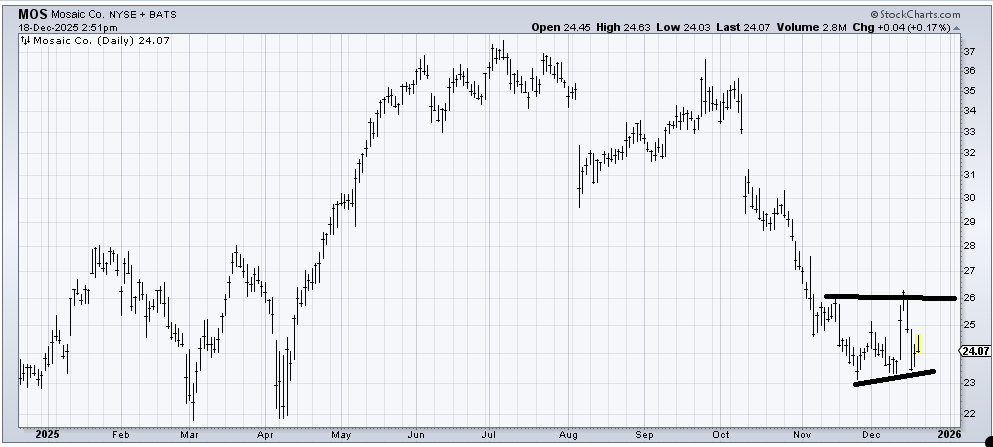
I have liked NTR, another fertilizer stock, for a long time, but I admit I am drawn to that chart of Mosaic (MOS) . One reason is the top measured to 23, which is where it got to, and so as long as it stays over 23, I think we see it rally again. I’d like to see it get over 26 on the next trip up. If it doesn’t do that, I’d get concerned.
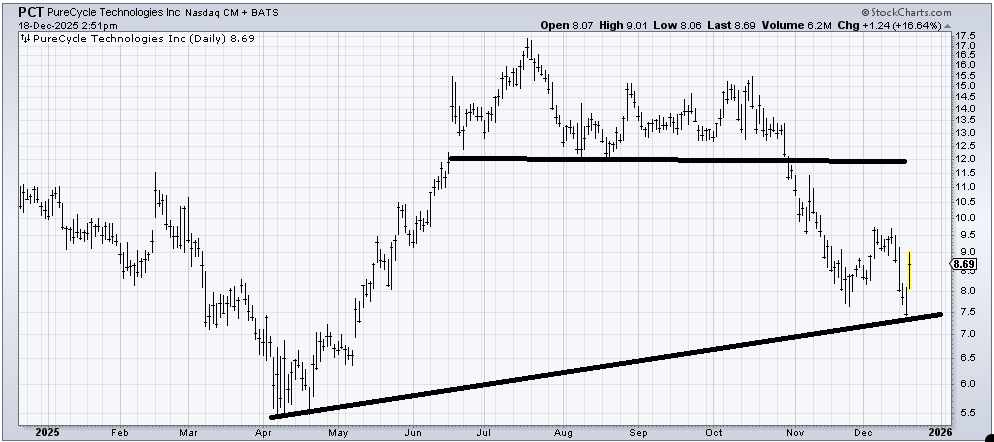
Pure Cycle Technologies (PCT) should rally to that 9.50-10 area. I would get very concerned if it can’t get over 9.50-ish.
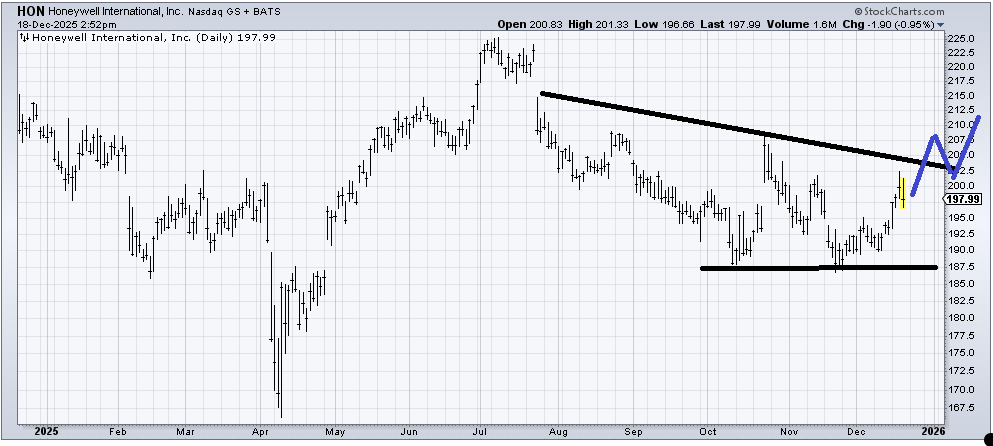
Honeywell (HON) still looks sideways to me. Now, if the chart can get to 207 and pull back and test the line, then the chart would look more interesting to me.
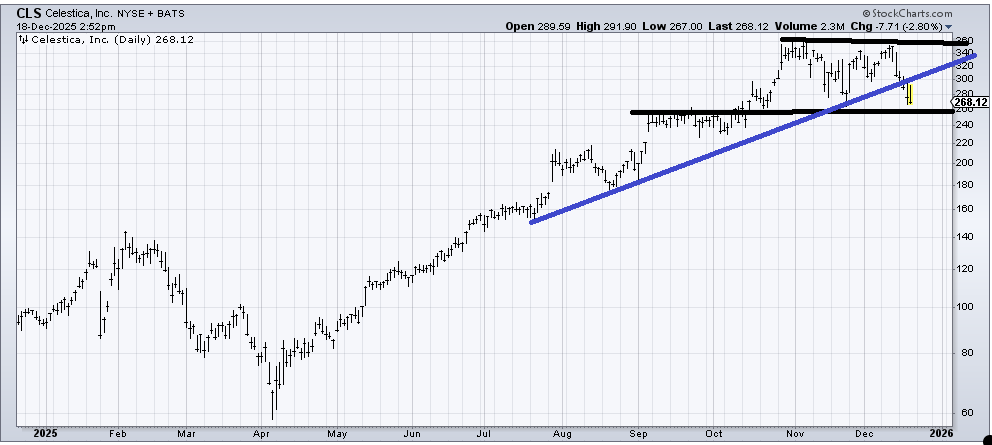
Celestica (CLS) has some support at 260. Enough to bounce, but I would think the bounce will fail. That’s because the blue line has been broken. The best it can do is trade between 260 and the blue line. If it breaks 260, it will complete a double top.
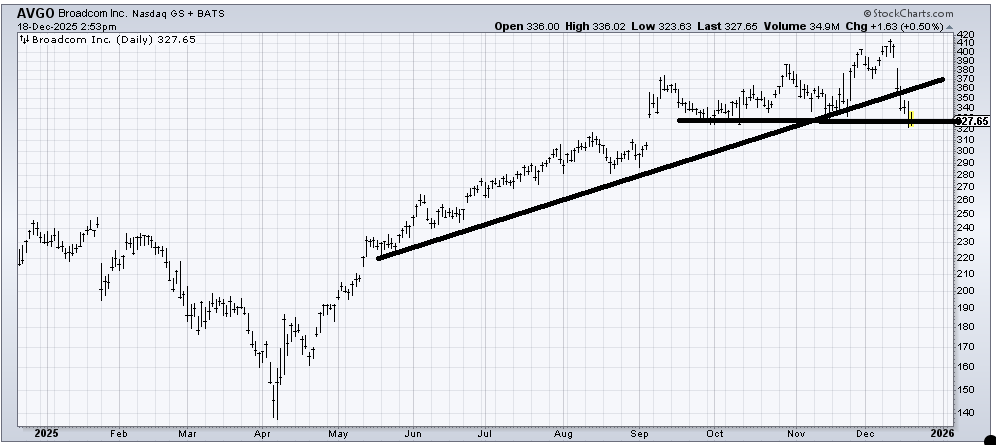
Broadcom (AVGO) should get oversold within a few days and bounce. Alternatively, a decline to 300 would fill the gap. If it takes the former path, I think the rally would fail (at the underside of the uptrend line). If it takes the latter path, then I think it would be grossly oversold on the gap fill.
Helene welcomes your questions about Top Stocks and her charting strategy and techniques. Please send an email directly to Helene with your questions. However, please remember that TheStreet.com Top Stocks is not intended to provide personalized investment advice. Email Helene here.
