Investors Are Positioned for a Rally, and That Makes Me Nervous
Historical patterns suggest elevated stock allocations often precede market turbulence—could this be another warning sign?
You've reached your free article limit
You've read 0 of 1 free Pro articles.
The Market
Well, the VIX lifted a smidge. I want it to spike, and it refuses to oblige me.
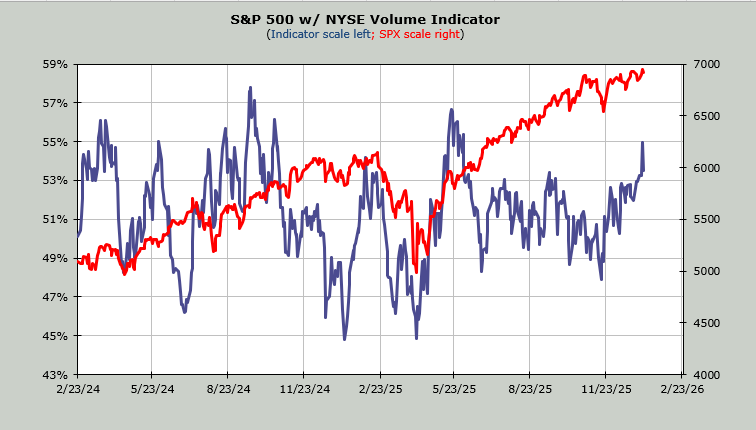
The intermediate term got overbought yesterday (30-day moving average of the advance/decline line). Down below, you will see the Volume indicator pushed into overbought territory as well.
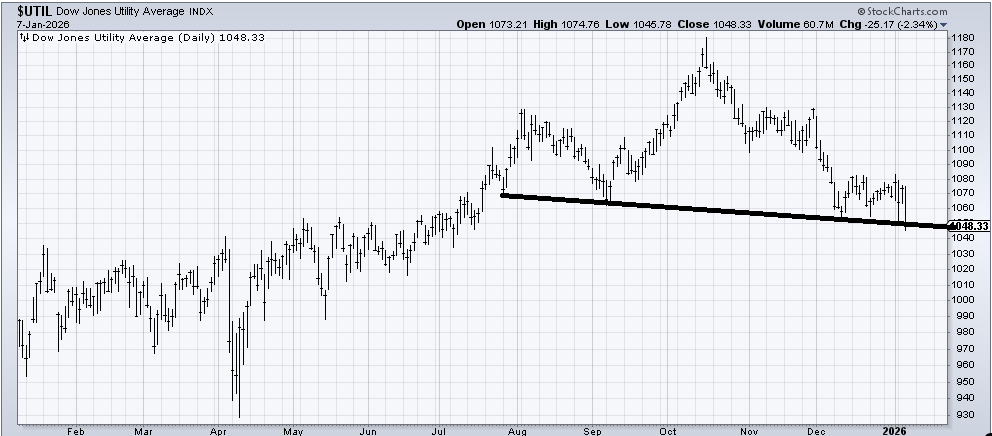
But what concerns me most is that the Utes cannot rally. Every single time they lift themselves up off the mat, they get pushed down. I should remind you that bonds rallied today.
The only way I can spin this as bullish is that it didn’t break the line. That’s it. The Utes are now lowest since July, and if that line breaks, it will complete a head and shoulders top with a downslanting neckline. I suppose the fact that there is so much support all the way down is good news, but this is the most concerning chart I have.
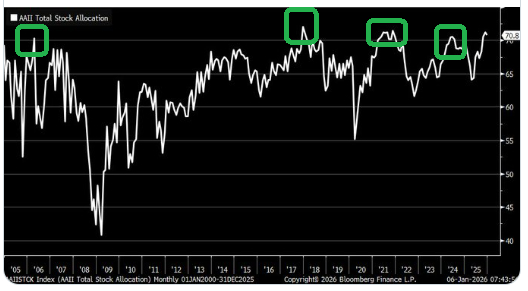
In terms of sentiment, we will see the AAII numbers tomorrow. They were a bit elevated last week, but what caught my eye is that, aside from the question of where they think the market will be six months from now (that’s the weekly survey), once a month, they are asked what their allocation to stocks is. It rarely gets up over 70% but in the month of December, it did just that.
You can see it has done so four other times. In 2006, it was essentially about a year before the actual high in the market, although if you were around then, you will recall the market started getting jittery in February 2007. It happened in early 2018, which is about 8 months before the 20% decline. It occurred in early 2021. The S&P kept going until November, but most stocks topped out in the first quarter. Finally, it got up there in late 2024, a few months before the Tariff Tantrum in April.
It’s probably not a great timing tool trading-wise but anyone who says folks are under-invested and not ‘all in’ would have to be looking at some very different metrics than this.
Today’s Investors’ Intelligence numbers showed bulls at 56.6% and bears at 17%. That puts the ratio at 3.35. Readings in the upper 3s/low 4s do tend to be good trading tools. We last got to 4.25 in late October.
I would still like to see the VIX get jumpy.
New Ideas
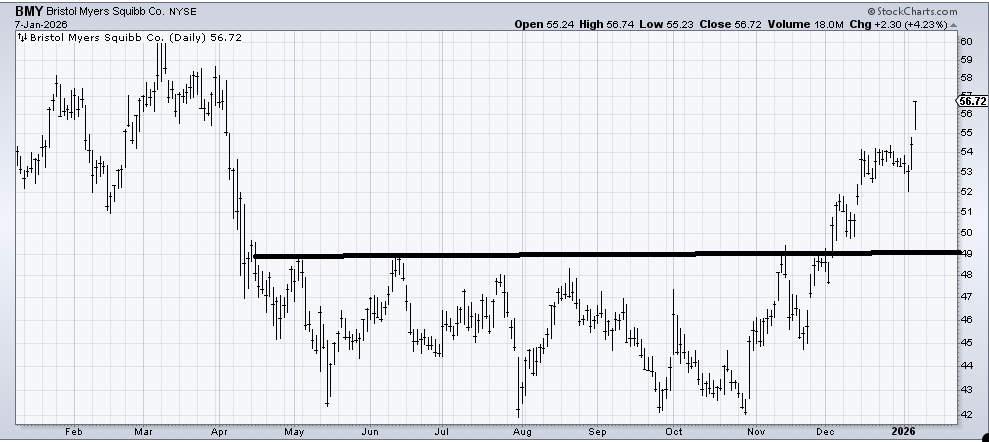
Our old friend Bristol Myers (BMY) finally rewarded us well this week, having broken out of the base back in December. That base measures to 56-57, and there is resistance in this upper 50s area. I wouldn’t blame you if you wanted to take a little off the table.
Today’s Indicator
The Volume Indicator got overbought at 55% on Tuesday. Today it is just over 53%
Q&A/Reader’s Feedback
Helene welcomes your questions about Top Stocks and her charting strategy and techniques. Please send an email directly to Helene with your questions. However, please remember that TheStreet.com Top Stocks is not intended to provide personalized investment advice. Email Helene here.
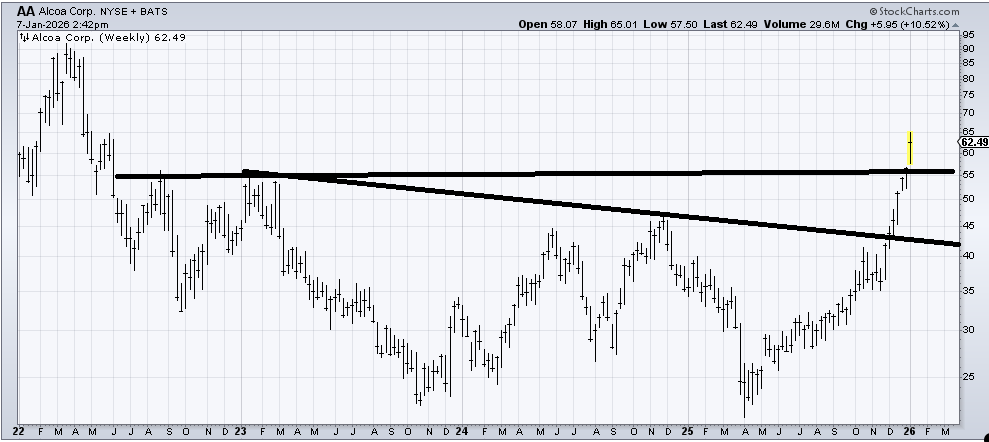
I have been bullish on Alcoa (AA) since it was in the 35 area. However, a couple of weeks ago, I said I thought this mid-50s resistance would be problematic. That has clearly not been the case, as it barely took a breather. I still think it is overdone up here, but I think pullbacks into the 50-55 area should be buyable. This is a weekly chart.
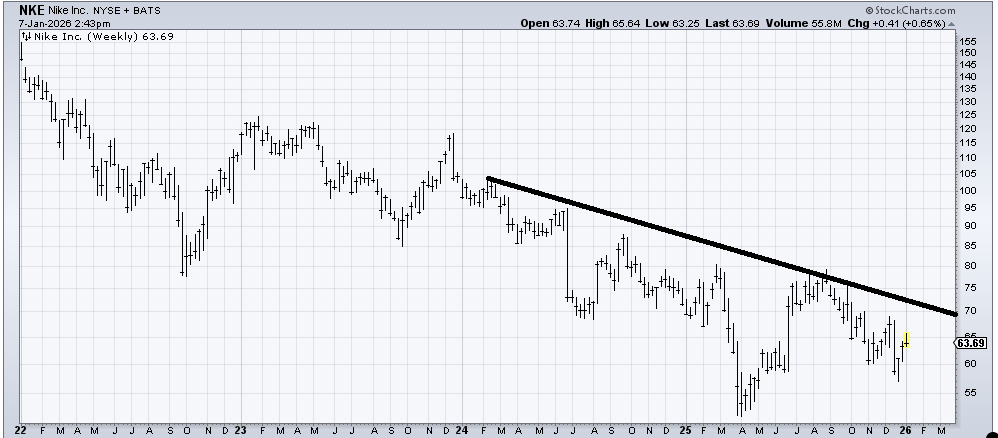
In the fourth quarter of last year, I had high hopes that Nike (NKE) would make a low and be a good stock in 2026. I still have high hopes, but as you can see on the weekly chart, as long as it stays under 70 (the downtrend line), I am only in the hope phase.
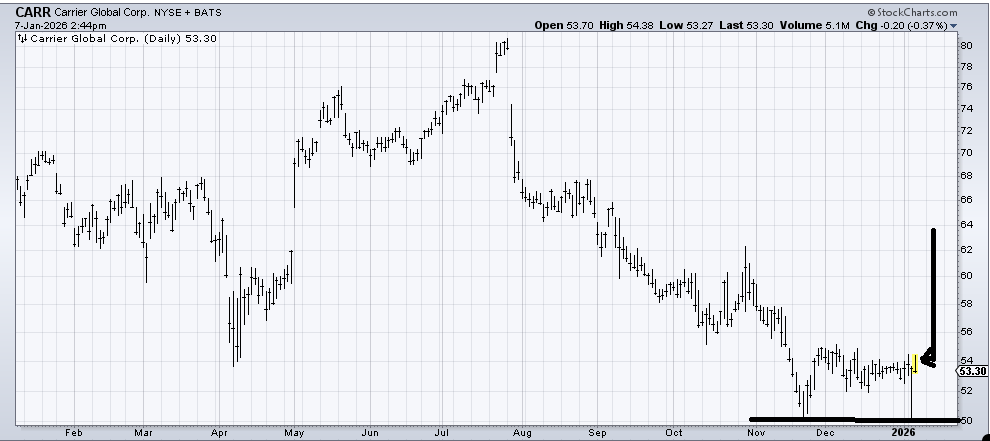
Carrier Global (CARR) had a terrific reversal on Tuesday. But no follow-through on Wednesday. A stop under 50 seems far away, but that’s what I see. The difficult part is that there are layers of resistance all the way up. 55 if the first, 56 is the next, then 60-61, and so on.