In This Either-Or Market, Today's Drop in NVDA Allowed the Others to Rally
NVDA shares fell today, so drugs and other stocks that had started to look good began to rally.
You've reached your free article limit
You've read 0 of 1 free Pro articles.
The Market
Did you see that? NVDA was down, so it allowed everything else to rally.
But there is more to it than that. There is an entire group of stocks that all rally together and sell off together. For example, what does NVDA have to do with Wayfair or First Solar? Ya, got me except that they are probably all in some basket of ‘hot stocks.’
Before I get to the statistics of the day, one question I was asked about late in the day was if there is any significance that several of the charts I have cited as bases that are likely to be a 2026 play rallied hard today, namely, drugs. But also, Rivian. And NKE. And energy.
I don’t have an answer except that we’re in an either/or market, and it seems today was the day someone (some algo?) decided to start buying drugs. Our job is to decide if this is a false start or if they are just getting going early.
My initial view is that my Overbought/Oversold Oscillator is based on breadth, so when it gets overbought or oversold, we should look at the 493. Recall, as I have been saying for a week now, it was set to get oversold midweek this week, and here we are.
I don’t have a time frame yet for the Oscillator to get short-term overbought yet. My initial thought is another week, perhaps something closer to Thanksgiving; it’s just too soon to say. I doubt we rally every day. And we may go back to a rotation day where NVDA gets all the love tomorrow. That’s the market we have.
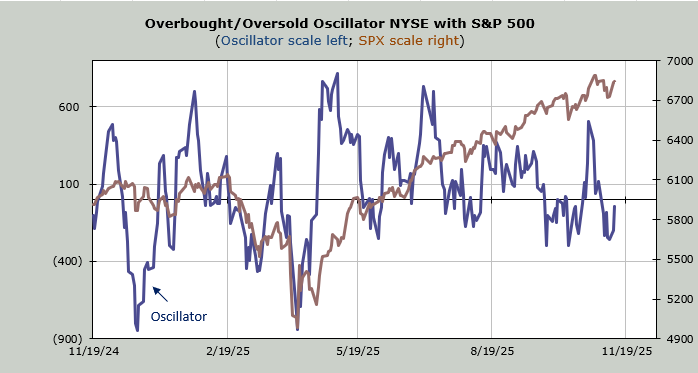
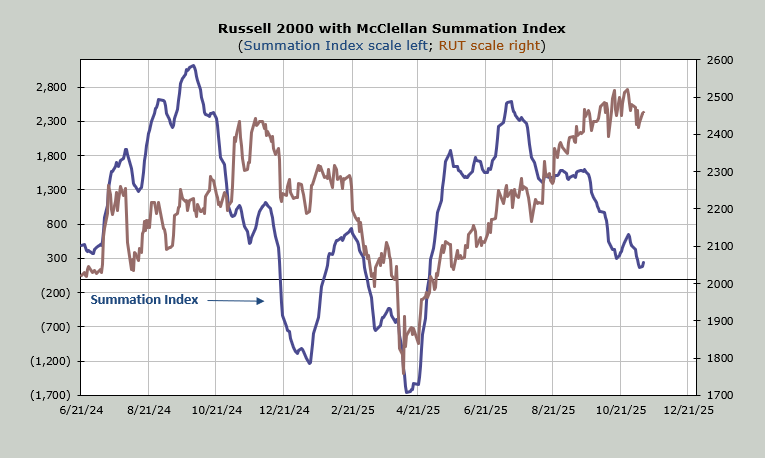
Statistically, the McClellan Summation Index stopped going down. A net differential of -900 advancers minus decliners will send it right back down, but this goes on the positive side of the ledger for the first time in months. The chart is shown below.
One final point is that I noted here on Sunday evening that the put/call ratio for the VIX had soared up over 1.0. Well, Monday also saw a reading over 1.0. That’s highly unusual, so many betting on a lower VIX (higher market). For now, we go with it. When we get back to an overbought condition and/or the DSI for the VIX gets back to being a teenager (currently 26) we’ll focus on it again.
New Ideas
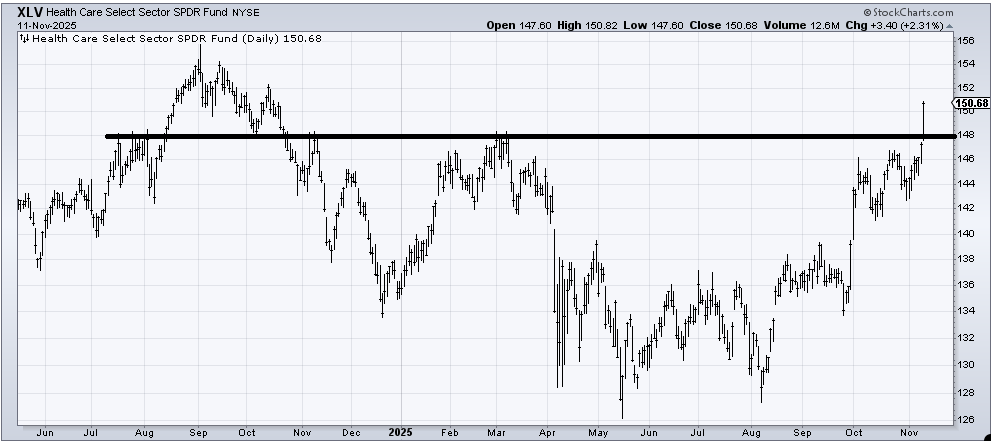
Since everyone seems to want to know where (XLV) measures to, I will say that it’s into resistance here (small), but longer term it measures to the 168 area. I doubt it gets there in a straight line. Should it dip back into the 146-148 area, I’d be a buyer.
Remember, we looked at (MRK) and (BMY) in the last few days. And (AMGN) several weeks ago.
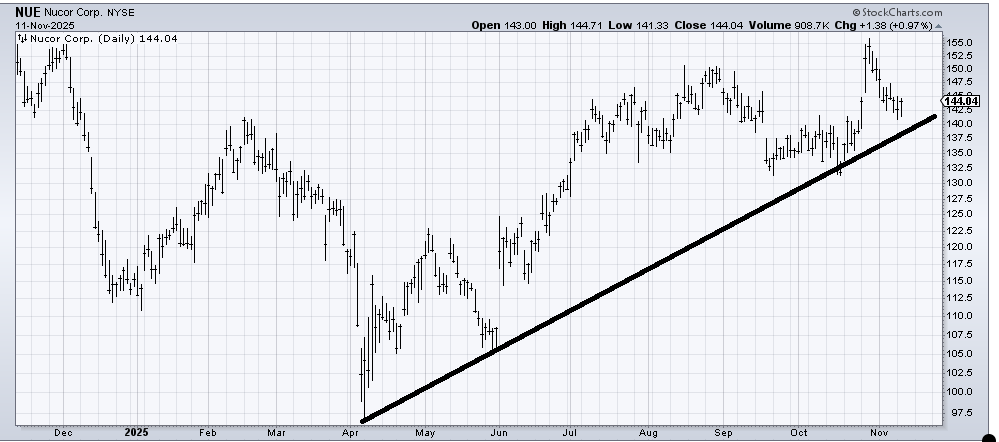
I’ve got my eye on Nucor (NUE) into this pullback. As long as that uptrend line does not break, this seems like a spot to add.
Today’s Indicator
The McClellan Summation Index is discussed in full above.
Q&A/Reader’s Feedback
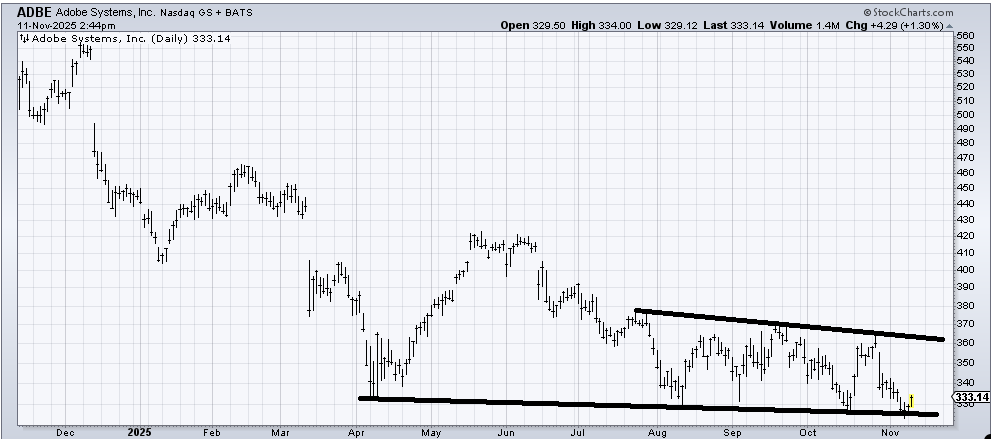
Adobe (ADBE) has been one of those tech stocks that cannot get off the mat. So sure it ought to bounce from here, but if it cannot get to that line around 360 and turns south before it gets there, I would expect it to break that lower line because the stock has not made a higher high since May.
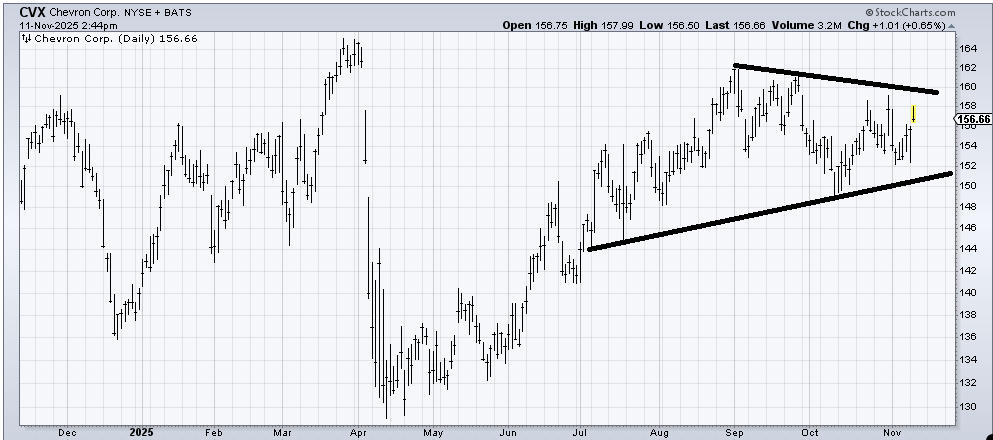
I like so many energy names ( (XOM) , (EOG) , (SLB) , (VLO) , to name a few), yet Chevron (CVX) feels sloppy to me, just sloshing back and forth in a range, and can’t even get to the September high. As energy comes alive (for now), I’ll give it a chance, but I’d keep it on a short leash and do not want to see it break that lower line.
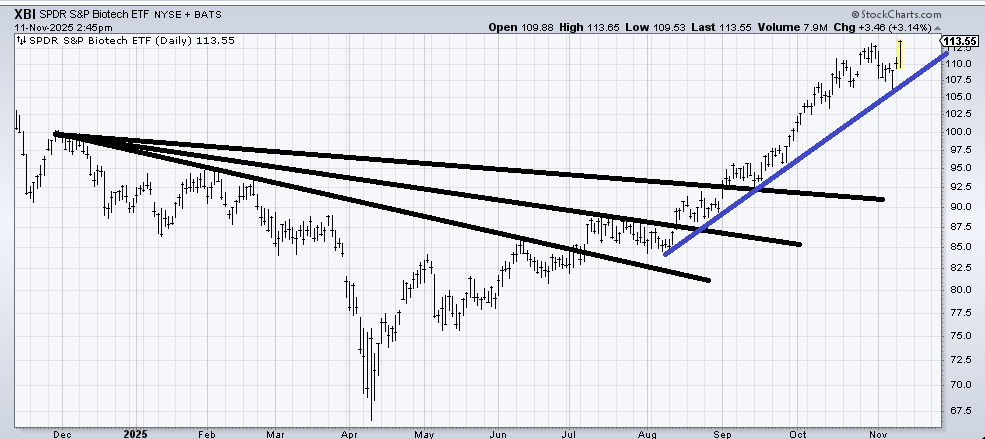
I have liked (XBI) (a similar chart to Alcoa) for several months now, and I think it is still okay. There is a measured target around 115 and another in the low 120s. A break of the blue line would have me running to the sidelines.
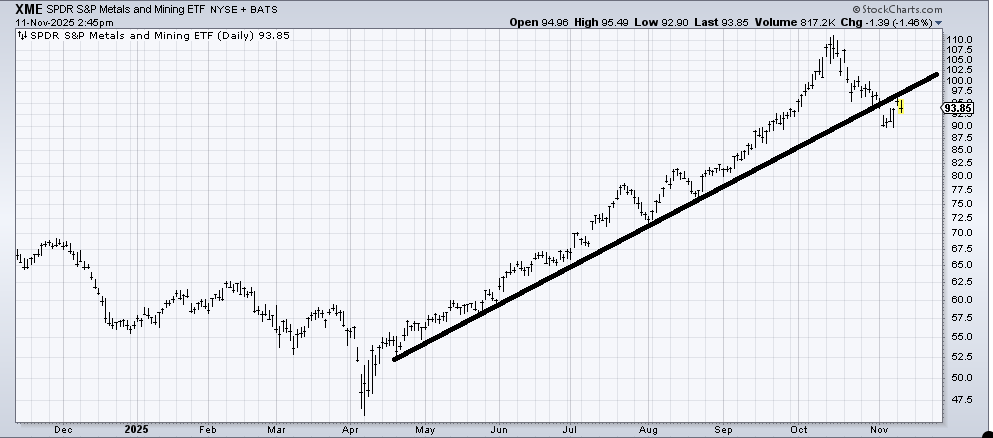
I am not yet willing to warm up to (XME) again. For now, I’ll call it a range of 90 to 100. That means if it breaks under 90, this is more than just a standard correction. If it gets back up and over 100, then the correction is over. In my view, it got overdone, and like GLD, I just don’t know if it is going into a corrective move like April to August or if this is something more.
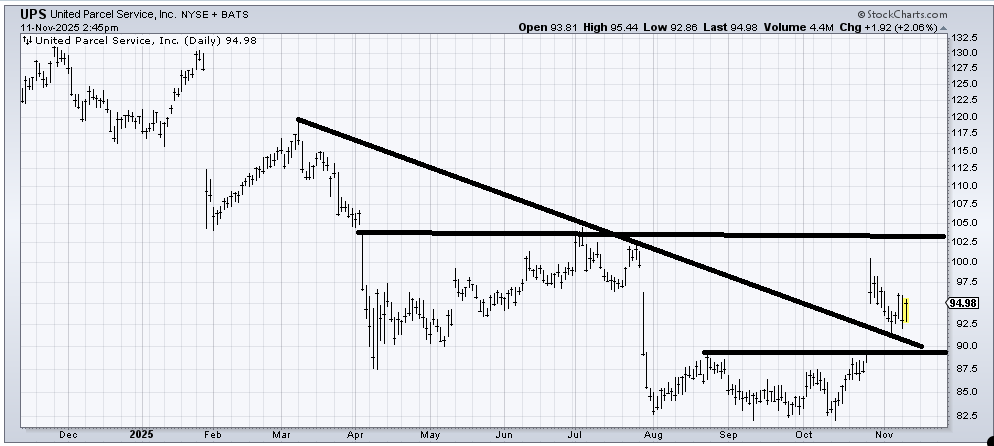
How long did I like United Parcel Service (UPS) , and it just wouldn’t rally? It has finally rallied and should rally again. I’d like to see another rally toward the 100-102 area. If the stock doesn’t fall apart before year end, this will start to look like a base instead of just a sideways move filled with gaps.
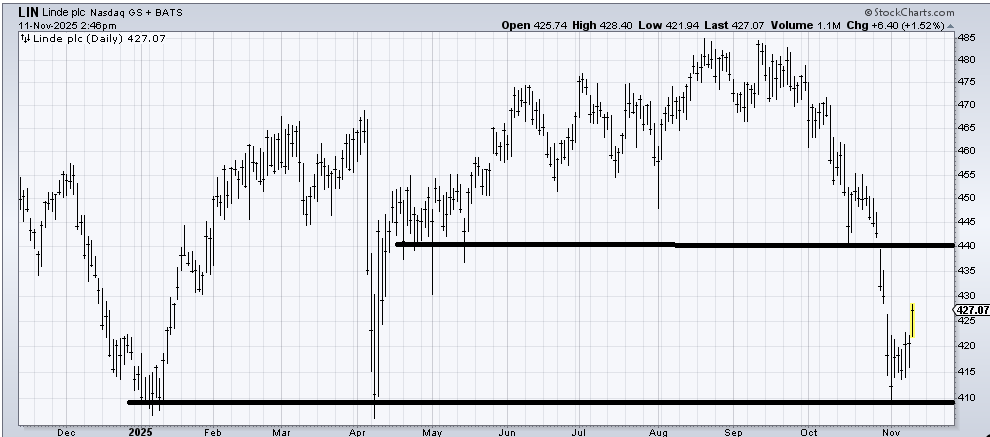
If Linde ( (LIN) ) can rally to that 440 area, it would be a good place to sell it.
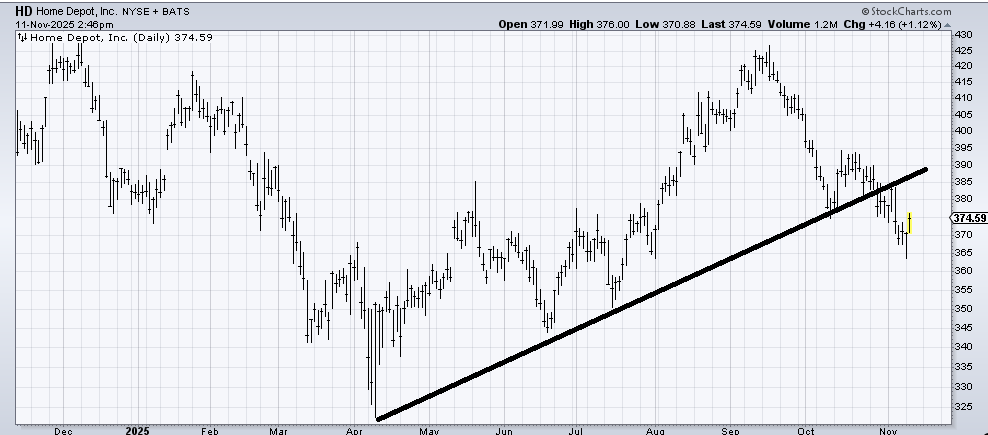
I had thought Home Depot ( (HD) ) would bounce off that line, and instead, the bounce went nowhere and then broke. Now I’d look to see if this bounce can get back to the broken line (385-390). If it can’t do that, I’d be a seller.
Note: in the homebuilding area, I still think Pulte (PHM) is trying to bottom here.
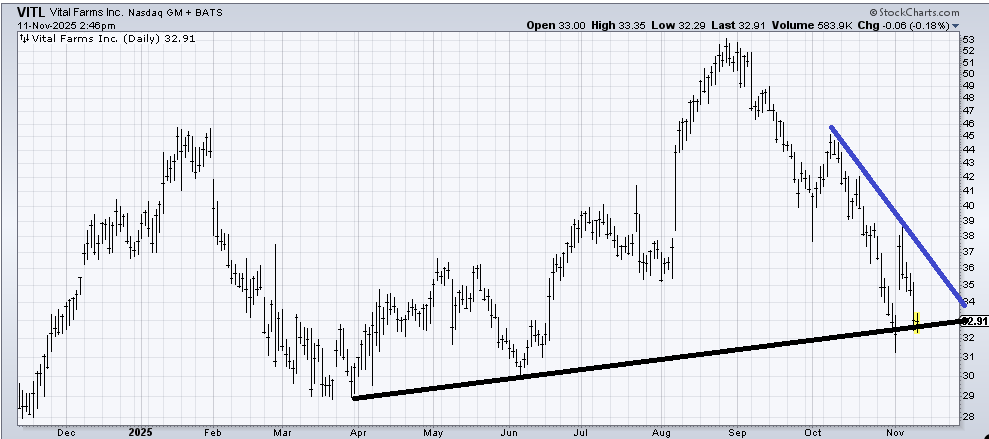
Vital Farms (VITL) will be an interesting chart for a trade (long) if it can hold this 32 area. I would not, however, fall in love.