In the War of the Stodgy vs. High Beta Stocks, Is Stodgy About to Win?
Here's the chart I'm paying attention to.
You've reached your free article limit
You've read 0 of 1 free Pro articles.
The Market
Monday is the first day of a new month, which can often be a rally day, but today I want to focus on one chart that we have looked at before but is once again in focus for me.
It is the chart of the S&P relative to Nasdaq. It made a low in late October, when Nasdaq made its high. That has happened before (see August). But here we are three months later, and that low is still in place.
Not only that, but it has also been making higher lows since then. It may fail here at this resistance line (call it .0295 if you are trying to monitor it on your own) as it has three other times since the low but if it cracks over it—and I typically like it to get over it enough that my bad eyes can see it—then it often means a bearish move is in the offing for the major indexes.
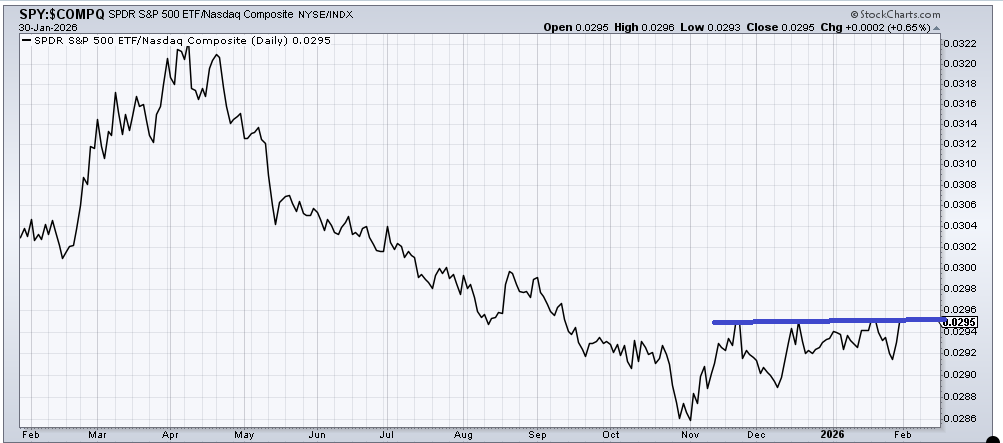
The thinking is that in times of market stress, the S&P tends to outperform the more high-beta Nasdaq. The S&P clearly has more so-called stodgy names in it, like the staples or the drugs. On the first trading day of this year, I said everyone is watching the RSP relative to the S&P, which is fine, but it was this chart that tells the bigger story to me. And that’s why I have it on my radar now.
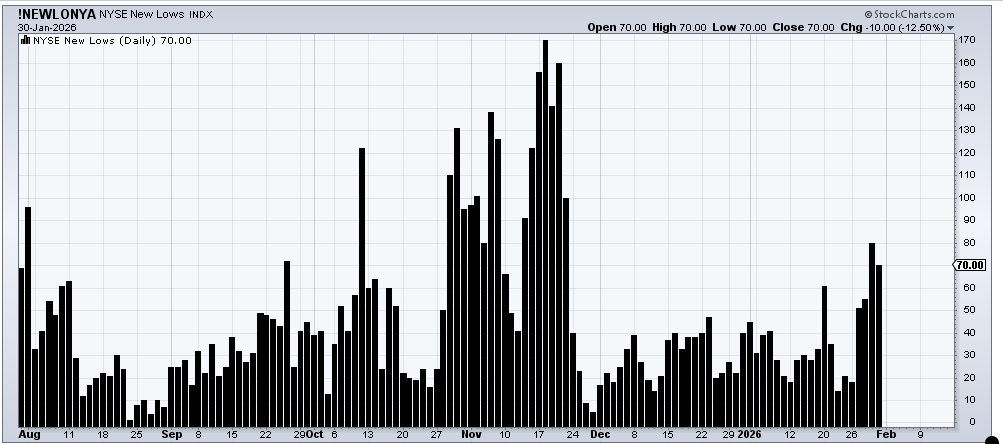
There was not much to say about Friday’s action that wasn’t said about Thursday’s action. The Bank Index held again. The new lows, though, did not expand, and the 493 continue their correction. And the VIX has now been green for six straight days.
The few new items are that the McClellan Summation Index stopped going up and is trying to roll over. It now needs a net +700 advancers minus decliners to get it to turn back up. And then there are the precious metals. They finally saw a break. And of course, despite the massive whack, the uptrend lines that were so far away actually held.
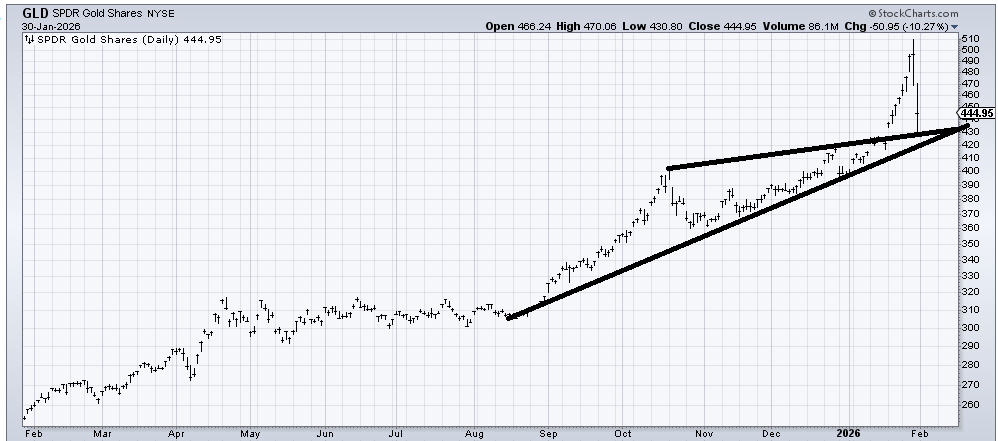
Here’s Gold (GLD) . Can there be more selling? Yes. In fact, I would be shocked if it turned right back up again. If it can go into a sideways digestion period, perhaps I will like it again at some point. Holding above 420-ish is key.
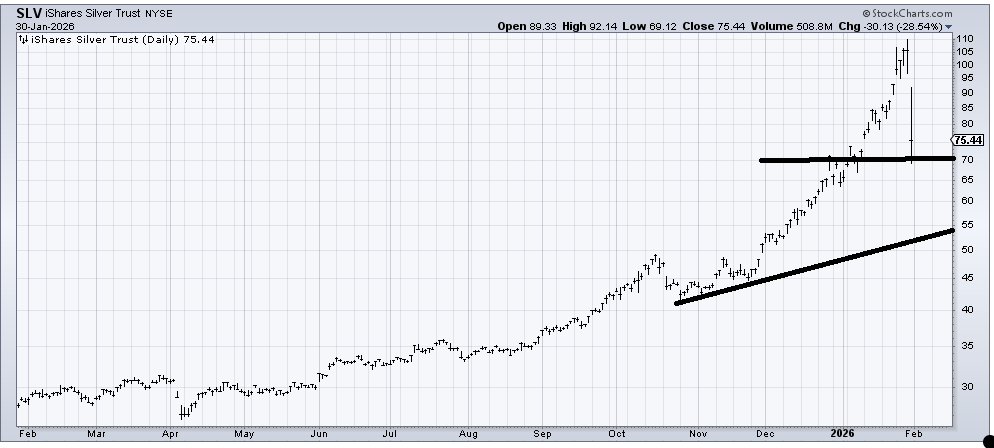
Silver (SLV) is a different chart. I want to make a big deal over the island top it left behind (all that trading last week over 95) because of the gaps on both sides, but then I look at the action in October and say it did the same thing. Leaving that aside, there is support in the 65-70 area. Here too I think it can bounce around, but unless or until it sets up a new pattern, I am not interested in being long it.
New Ideas
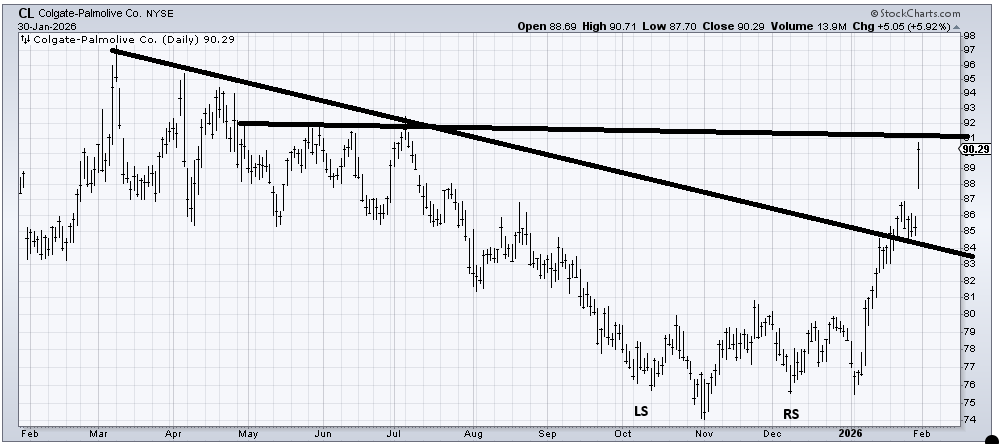
I recommended Colgate (CL) a few months ago when it was forming what I thought could be a head and shoulders bottom (December). On Friday, it gapped up on earnings. Crossing that downtrend line was a big plus, but it is also into some heavy resistance now. It would be my inclination to take a little off the table here and wait for it to eat through some of that resistance in the upper 80s. I do think it eventually gets through, though.
Today’s Indicator
The new lows did not expand on Friday. But the indexes did not make a lower low either. However, it would be bearish if we got more new lows and the indexes did not make a lower low.
Q&A/Reader’s Feedback
Helene welcomes your questions about Top Stocks and her charting strategy and techniques. Please send an email directly to Helene with your questions. However, please remember that TheStreet.com Top Stocks is not intended to provide personalized investment advice. Email Helene here.
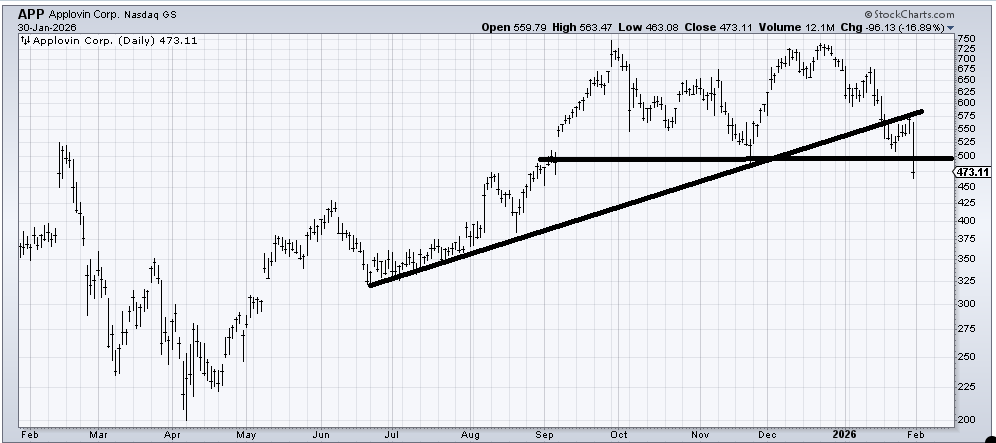
Applovin (APP) broke down on Friday, and while it has layers of resistance all the way down now, I go back to my rule of thumb on this: if it can recapture 500 quickly (say a week or so), then I would treat this as a false break. If it can’t, then longer term—think months, not weeks—it measures down to that 325 area.
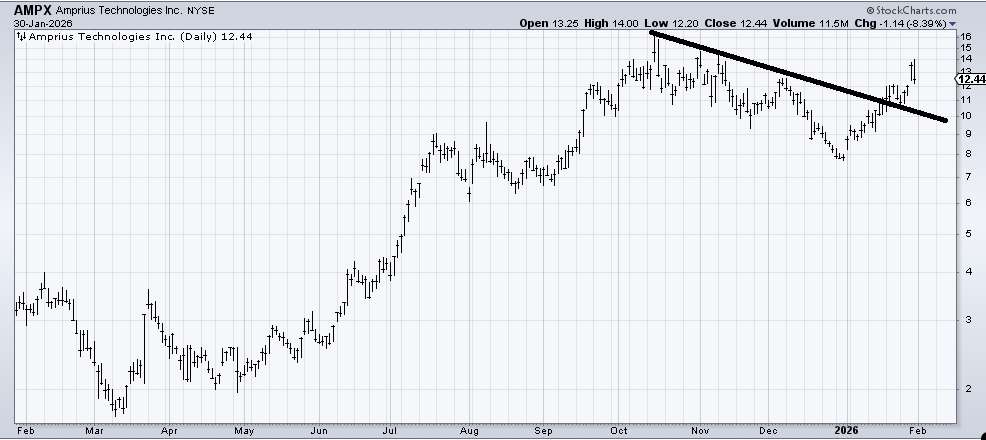
Amprius Technologies (AMPX) needs to be watched closely. There are a few scenarios I have in mind. First, it gapped up into resistance (see CL above, same situation). But then it gave back much of the previous day’s gains without closing the gap. So if it gaps back under 12, that’s bearish because it leaves the last two days as an island. If it gradually pulls back into that 10-11 area, it will probably be okay. If it holds over 12, then I would take that as a stock that is chewing through resistance. That’s why the next few days matter.
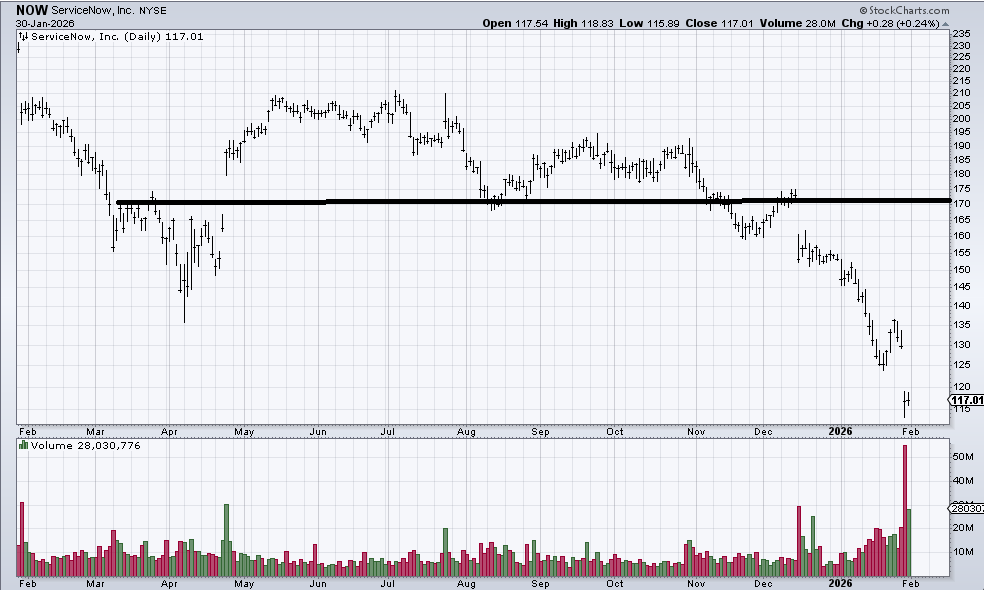
ServiceNow (NOW) is a fascinating chart to me. That top (and yes, I know it’s a funky line, but please indulge me) it broke down from measured to the 130-ish area, which is where it got to just before that earnings gap down the other day. But the stock has been selling off since May and gapped down in December. Sure, maybe I might have said in December the volume was high enough to see a bounce, but now look at the volume: 5x average daily volume, and on a second gap down. If NOW can hold here and not collapse further (as it did in December), I would think the base building can begin. If it can gap up over 120 and leave the last two days behind, that would be an island (bullish). So, unless it continues just dribbling lower from here, I would start looking for stabilization.
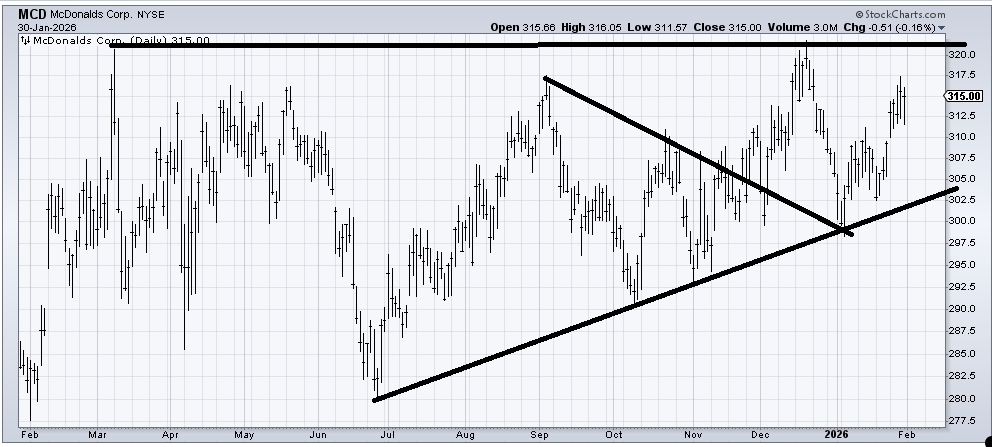
The question is if I still like McDonald’s (MCD) . I do. I did not like that slide from 320 to 300, but it held support. My guess is 320 is still resistance, but as long as it doesn’t break that uptrend line, I think the chart is still okay.