In Between Panic and Anxiety, Looking for a Place to Sell
The indicators are finally showing some panic, but maybe not enough. Here's what could happen this week.
You've reached your free article limit
You've read 0 of 1 free Pro articles.
The Market
Here’s what we had on Friday.
The VIX got jumpy. Downside volume was 92% of total volume on the NYSE. The put/call ratio ended the day at 1.18 so that makes consecutive days with the reading over 1.15. The ISE call/put ratio gave us a reading under 1.0. The QQQs traded nearly 120 million shares.
Not quantifiable, we also had folks finally selling their staples, utes, REITs and even the non-US stocks got sold. That’s what finally got us to a 90% down day. So, I guess it is quantifiable.
The DSI for Nasdaq got to 9, and the S&P is at 10, which is a lot more than I would have expected they could do, considering they were around 30 on Wednesday.
In terms of being oversold, my own Oscillator is shockingly not that oversold; it’s moderately oversold. Nor are my intermediate-term indicators oversold the way we would imagine they should be by now.
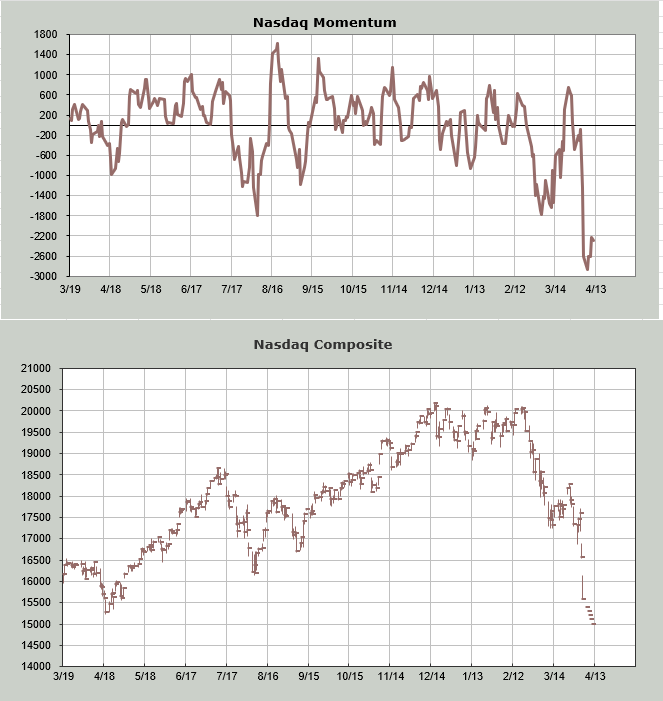
However, the Nasdaq Momentum Indicator gets oversold at the end of trading on Monday. Keep in mind, this is not meant to pick the exact day, but it is meant to give us a general time frame, so let’s say early this week.
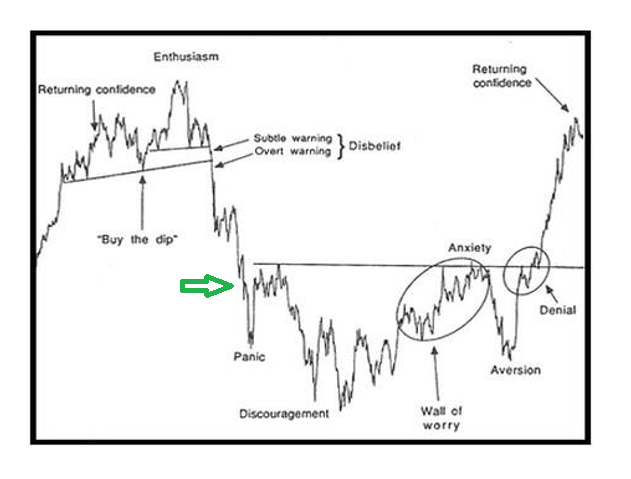
I have used this chart of the Sentiment Cycle before, but I find it helps folks imagine how I envision things playing out. The pattern itself is what matters, not the magnitude. I think we are somewhere close to that green arrow (prior to last week, I thought we were in that pattern to the right of the words ‘buy the dip’).
A further decline on Monday would have me thinking we are at Panic. Okay either way, if we are there or just about there, notice that rally off Panic is sharp and lasts longer than a day or so. But eventually, we come back down.
Will Monday bring us more selling? It’s possible. But I think we should finally be looking for a short-term rally this week.
And don’t forget this is a trading market.
New Ideas
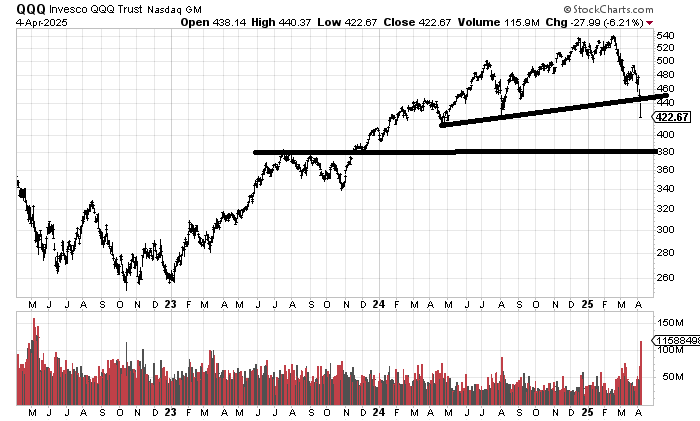
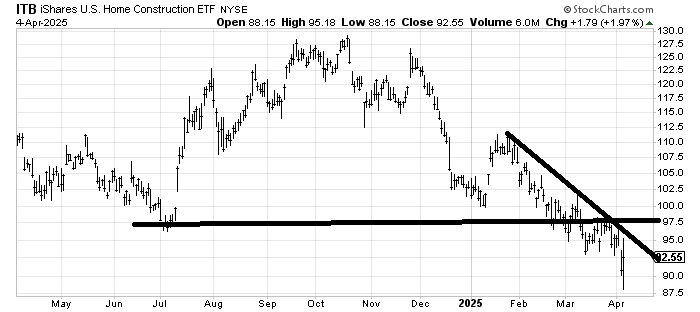
My view on what to buy for a rally will almost always be the same: we look to an index which means SPY, QQQ, IWM. We also look toward what has been down the most, so I would put the SOX in that category. Please note the Homies had a big reversal on Friday, and we all know they have been heading down for more than six months
Today’s Indicator
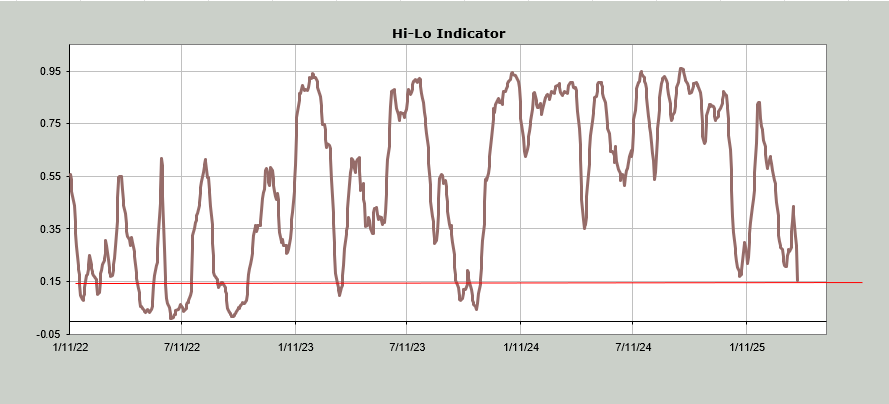
The new lows were off the charts on Friday, with the NYSE at 1042 and Nasdaq at nearly 1500. Eventually, that will be tested with a short-term oversold rally and another move back down.
Nasdaq’s Hi-Lo Indicator is at .11 while the NYSE’s finally got to .15. Under .15 and it gets oversold. Even if we rally on Monday, this ought to fall under that level. I’d actually be shocked if this doesn’t get to near single digits before it turns.
Q&A/Reader’s Feedback
Helene welcomes your questions about Top Stocks and her charting strategy and techniques. Please send an email directly to Helene with your questions. However, please remember that TheStreet.com Top Stocks is not intended to provide personalized investment advice. Email Helene here.
You are going to notice that despite the market getting short-term oversold and some of the indicators calling for a rally, I am going to spend more time on where to sell charts rather than where to buy them.
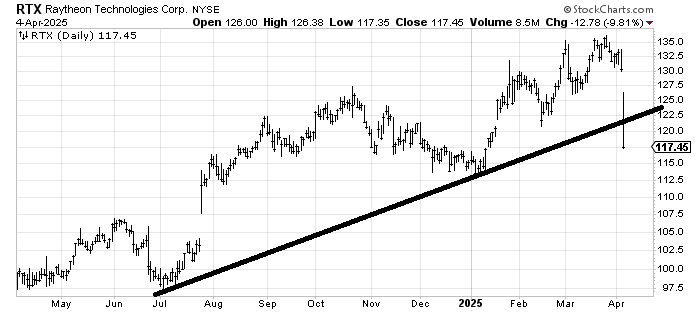
Raytheon Technologies RTX has support in the 112-115 area, so it ought to bounce. If I am wrong, then the gap fill near 105 is the next support. But I’d be a seller on a rally back into the 120-122 area if the bounce is from the 115 area. If it’s from lower, the resistance is around 115.
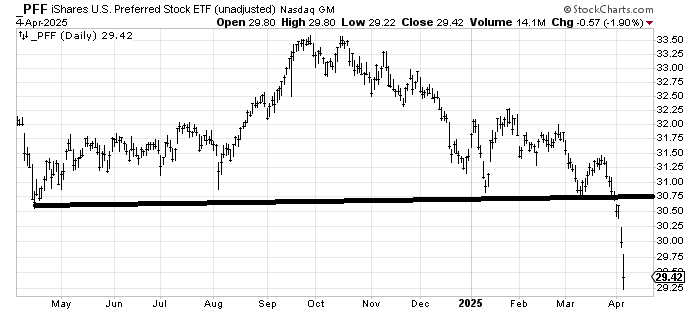
PFF is an ETF to be long preferred stock. That is one giant top it broke down from. A rally to the 30.50-30.75 area is where I would sell it. It has a downside target around 27.50-ish.
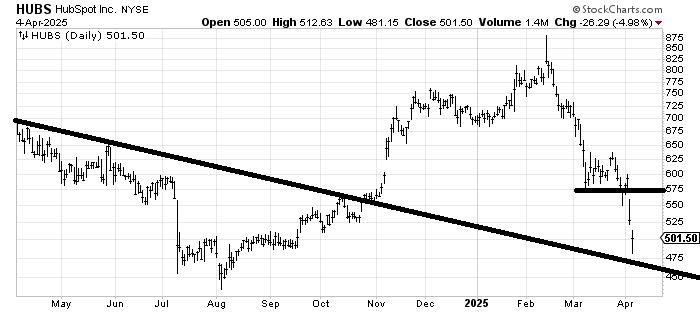
HubSpot HUBS has some support in the 450-475 area. If it can rally to 575, I’d be a seller there.
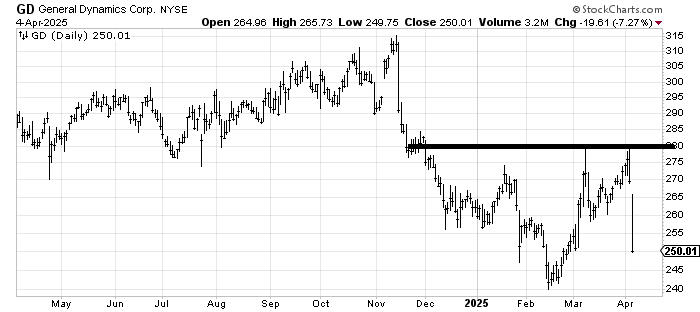
We got lucky with General Dynamics GD in that it rallied right to where it should have before it swan dived. If it is going to start a bottoming process—still a big if—it ought to hold the 240 area and bounce, but here is an example of a stock that didn’t see a great deal of selling last week, so I’d wait and see how it settles out. If it rallies to 260-ish, I’d sell.
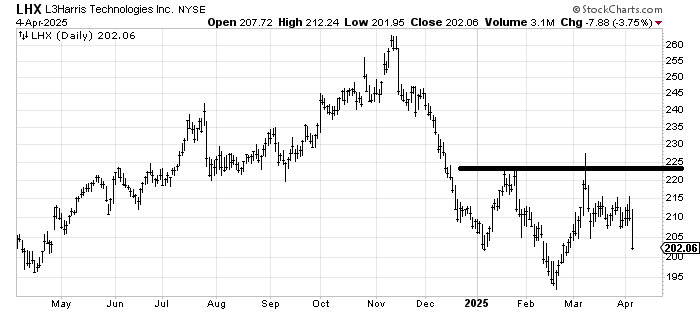
In a normal market environment, I would be thinking this chart in L3Harris LHX is working on a head and shoulders bottom. But here, too, the panic selling only started Friday, so there’s a lot of proving that needs to be done for me. If it rallies to the 208-210 area and can’t do more than that, then I think the next leg down is to retest the lows near 190 (at least).