In a Traders Market Like This, Always Pay Attention to the Indicators
Expect a lot of volatility over the next month. The indicators will provide a roadmap.
You've reached your free article limit
You've read 0 of 1 free Pro articles.
The Market
Over the next few weeks, I anticipate there will be times when I say the market looks primed for a bounce or a short-term rally. For example, right now with the SOX having been red for seven straight days (more on that below), I would anticipate such a bounce, but overall the intermediate term indicators have reached an overbought condition and some have rolled over, so for the time being I would expect such rallies to be short lived.
I do not expect the market to roll over and collapse, though. There just aren’t enough signs that it is situated for such a slide. Typically, the indicators need to be in firm downtrends before the indexes can slide so easily, and they have just turned down from an overbought condition. And sentiment needs to be complacent, which I don’t think it is.
Can I be wrong, and we just keep zooming? Yes. Except the S&P is already down 3% from the highs, and the small caps, on an intraday basis, already tagged 5% Friday. Can I be wrong, and we just head south in a meaningful way? Yes. But notice how last Thursday the equity put/call ratio zipped right up to .75, showing that, unlike February and March, folks, having lived through the March/April decline, are more apt to have a quick trigger finger (on the sell side). Thus, I think we should anticipate some more downside over the next month, but more so, it feels like more volatility.
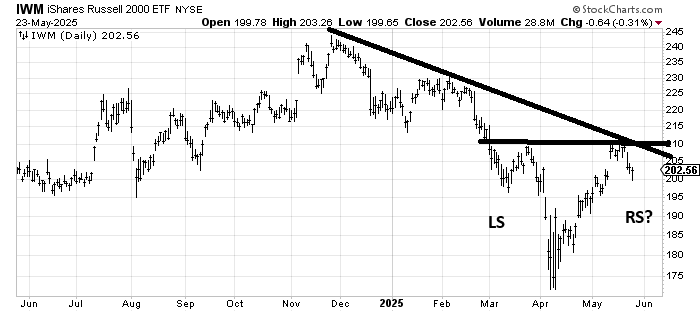
Many will see the head and shoulders bottom—or potential ones—in charts such as IWM and see it as bullish. After all, IWM filled that ‘China deal’ gap, and somewhere between 195-200 would be very symmetrical, almost out of a textbook. Heck, why not?
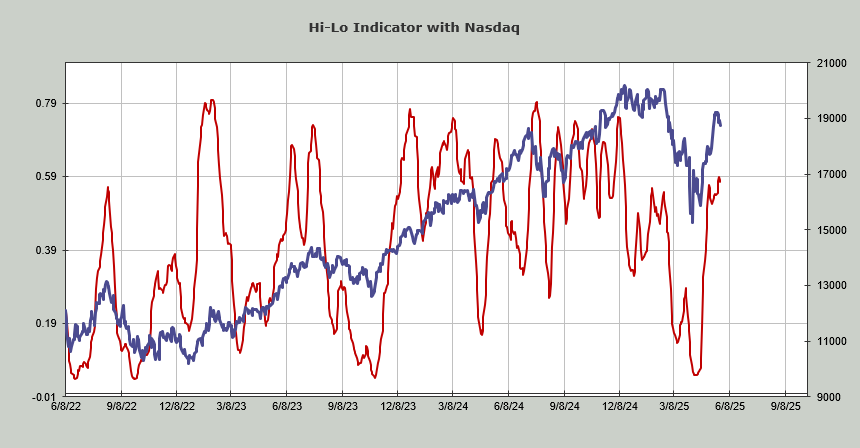
For me, it is always about the indicators. The McClellan Summation Index is heading down. It needs a net differential of +1800 advancers minus decliners to halt the slide now. The Volume Indicator tagged 57% last week, so that is now fully overbought. The 30-day moving average of the advance/decline line is overbought now as well. And even the Hi-Lo for both Nasdaq and the NYSE have curled down (shown below). Until those indicators either get back to an oversold condition or stop heading south, the general thinking is ‘correction’ for most stocks.
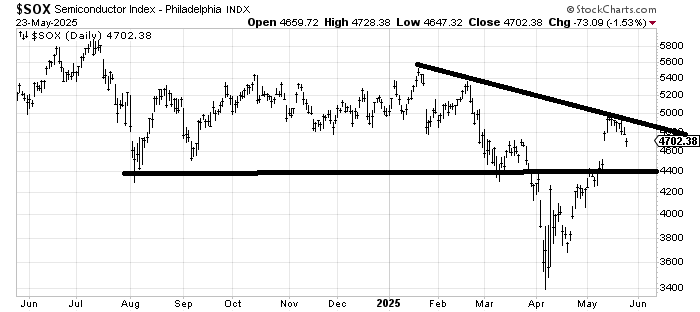
Yet we look at a chart of the SOX, which has now been down for seven straight days. It turns out that is actually quite rare. I looked back at the last 15 years, and curiously, that has only occurred four times. Only once was such a long red string at a low, and that was when the SOX had been bottoming for three months, in November of 2011, so the chart looks quite different then vs. now.
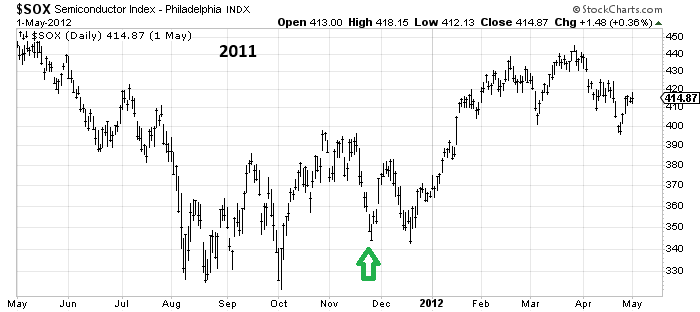
In the other three cases, there was a bounce (i.e. we never went to 8 straight days), and we went back down. The good news? Each time, regardless of how much more we went down (between 7 and 20%), that decline led to a good rally opportunity. We did not just keep on sliding for months.
So, yes, I think the semis should bounce, likely on Tuesday (no 8-day losing streak), but based on this small sample of the prior incidents, I expect at the very least that gap near 4500 ought to be closed before we get to another intermediate-term oversold condition. And yes, I know NVDA’s earnings will probably have a marked effect on the next few days.
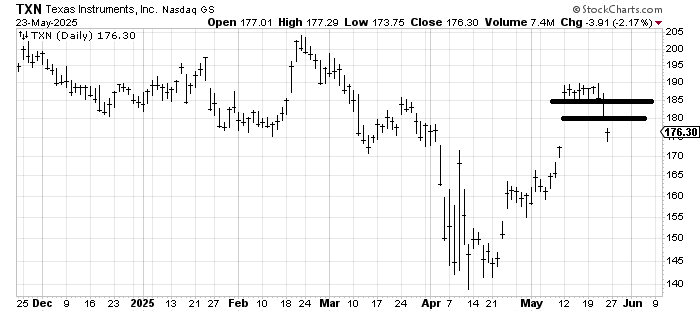
I have used Texas Instruments TXN as an example of a semi-stock to look at in the last month or so, and notice that it’s already down 7%, coming awfully close to closing the gap from the China deal day. I would imagine any rally to the 180-185 area now meets resistance.
I have said before, but not in a while, that I think 2025 is a trading market, and I think we will find the month of June brings us back to that market.
I chatted with Liz Ann Sonders of Schwab last week. If you would like to listen to the podcast, here it is:
New Ideas
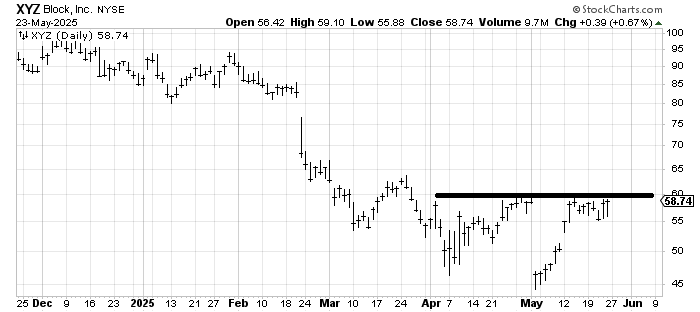
Every time I look at the chart of Block XYZ I think of ‘the stock formerly known as…’ because it has changed its name so often. It has been trying to bottom for three months now. I think it can get over 60.
Today’s Indicator
The Hi-Lo Indicator has rolled over.
Q&A/Reader’s Feedback
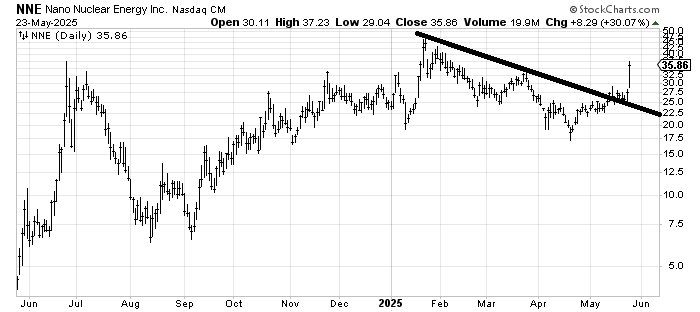
Someone has inquired about the nuclear names but they have all moved explosively late last week so long time readers know I am uninterested in chasing them even though they have decent charts.
Nano Nuclear NNE has a measured target in the 41-44 area which happens to come close to that January spike high.
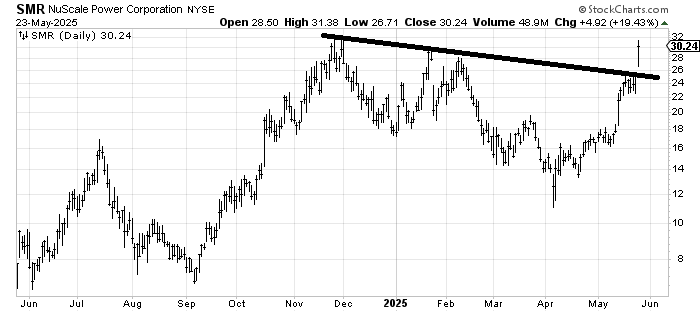
NuScale Power SMR has some resistance at the old high of 32-ish) but the measured target would be in the low 40s.
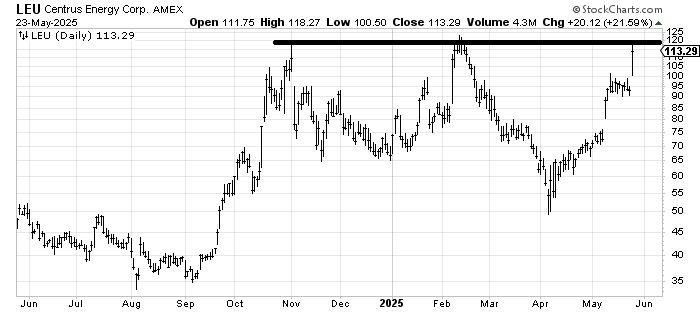
Centrus Energy LEU is already at its prior highs so unless it surges over this 120 area or flags here it’s hard to get excited over it. Notice how often it has surged only to go straight into a correction thereafter. You should want it to flag here before breaking out.
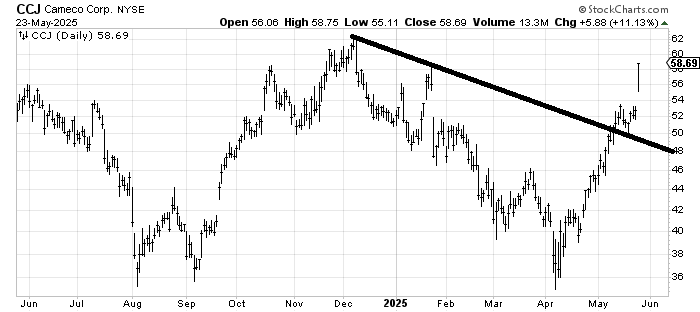
I think Cameco CCJ is apt to stall out at the old high, but it measures longer term to the 75 area.
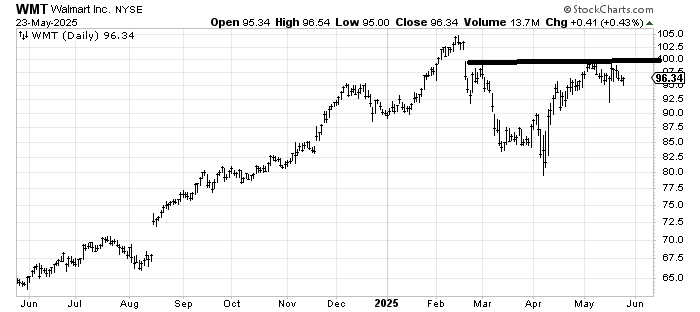
Walmart WMT is the perfect example of a chart that says ‘volatility’. The correction from 100 was minor (5%), but that whoosh down to 92 and subsequent rebound—but only back to where it started) is an example of volatility. For now, I’ll call this chart possibly toppy but more apt to trade between 90 and 100.
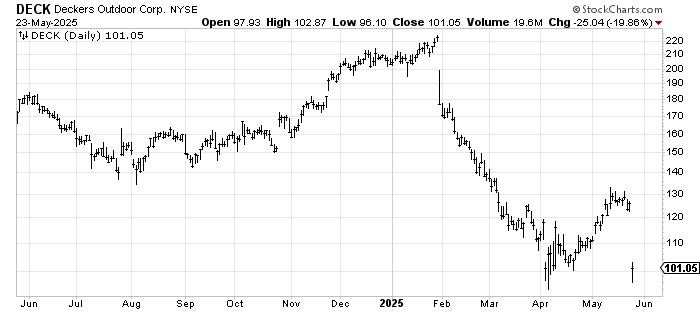
Deckers Outdoor DECK looks like it has done/is doing what I often note: spike lows tend to hold on the first trip back down. April was a spike low, and Friday, the buyers (short coverers?) showed up in the same place. I am not a buyer, but I would expect a bounce from here.