I'm Working Out My Peloton Trade Again
Here's why I'm cycling back to this pandemic home-gym stock and how I plan to turn a profit.
You've reached your free article limit
You've read 0 of 1 free Pro articles.
It was only about three weeks ago that I wrote to you regarding one of my less successful leftover "Stocks Under $10" holdings: Peloton PTON.
I reported that I was exiting the pandemic workout-at-home darling that made like a pea rolling off of a table once folks were comfortable returning to the gym. But now, I'm cycling back to the home workout name. Let me explain.
Readers may recall that I as I decided to exit PTON, I expected it to test its 200-day simple moving average from above, which it did. Peloton then failed that test.
I also wrote that I would consider reentering PTON close to that 200-day level. After losing its 50-day simple moving average on March 10, PTON regained that level on March 14 and traded back and forth between its 50-day simple moving average and its 21-day exponential moving average for six trading days as the algorithmic traders made selecting a point of entry just above the 50-day simple moving average easy. Did I lose some cash on the exchange? Yes. Have I already made that loss and more up? Yes, as on Monday, PTON crashed through that 21-day exponential moving average to the upside, bringing a few swing traders with it. Rock on.
Earnings
We already know that Peloton reported an unadjusted loss per share of $0.24 on revenue of $673.9 million for its fiscal second quarter, which ended with year's end. Those earnings fell about a nickel short per share of consensus view. The top-line print did beat Wall Street's expectations, but still was only good for a year-over-year contraction of 9.4%.
It was the guidance that I found encouraging. Peloton increased its full fiscal year guidance for adjusted earnings before interest, taxes, depreciation, and amortization from $230 million to $290 million, up to $300 million to $350 million, and took the stock's target for full-year free cash flow from $125 million up to "at least" $200 million.
As I mentioned three weeks ago, Peloton was able to reduce its total debt load by more than $190 million on a year-over-year basis and cut net debt by 30%. Talk about something interesting. Talk about impressive. As followers of this series know, I love improving fundamentals and overt, measurable fiscal discipline.
For the current quarter, which will be reported in early May, Wall Street is looking for an adjusted loss per share of $0.07 or an unadjusted loss per share of $0.04 on revenue of $620.4 million. On a year-over-year basis, this would reflect a sales contraction of 13.5%, but due to that fiscal discipline would be an improvement from an adjusted loss of $0.45. Oh, did I mention that since the current quarter started, 12 of the 13 analysts I know of that track the stock have increased their earnings estimates.
The Balance Sheet
The balance sheet is not nearly as awful as you may have been led to believe. As of Dec. 31, the company had a cash position of $829 million on the books and current assets of $1.308 billion. That included $257.8 million worth of possibly questionable inventories. Current liabilities ran at $634.7 million, including almost no short-term debt and $80.7 million worth of unearned revenue, which is not a true financial liability.
This left the company's headline current ratio at a very healthy 2.06 and its current ratio at a still healthy 1.65. Once adjusted for unearned revenues, these ratios rise to 2.36 and 1.89. Psst ... Peloton can manage and meet its obligations going forward.
Total assets amount to $2.11 billion, including just a tiny number for all intangibles. Here's the catch. Total liabilities less equity come to $2.607 billion, including long-term debt of $1.489 billion. This is all long-term debt, so it's not an emergency, but this will at some point, have to be managed. Of course, positive free cash flows, which Peloton has had now for four consecutive quarters, will help accomplish this mission.
Evolution
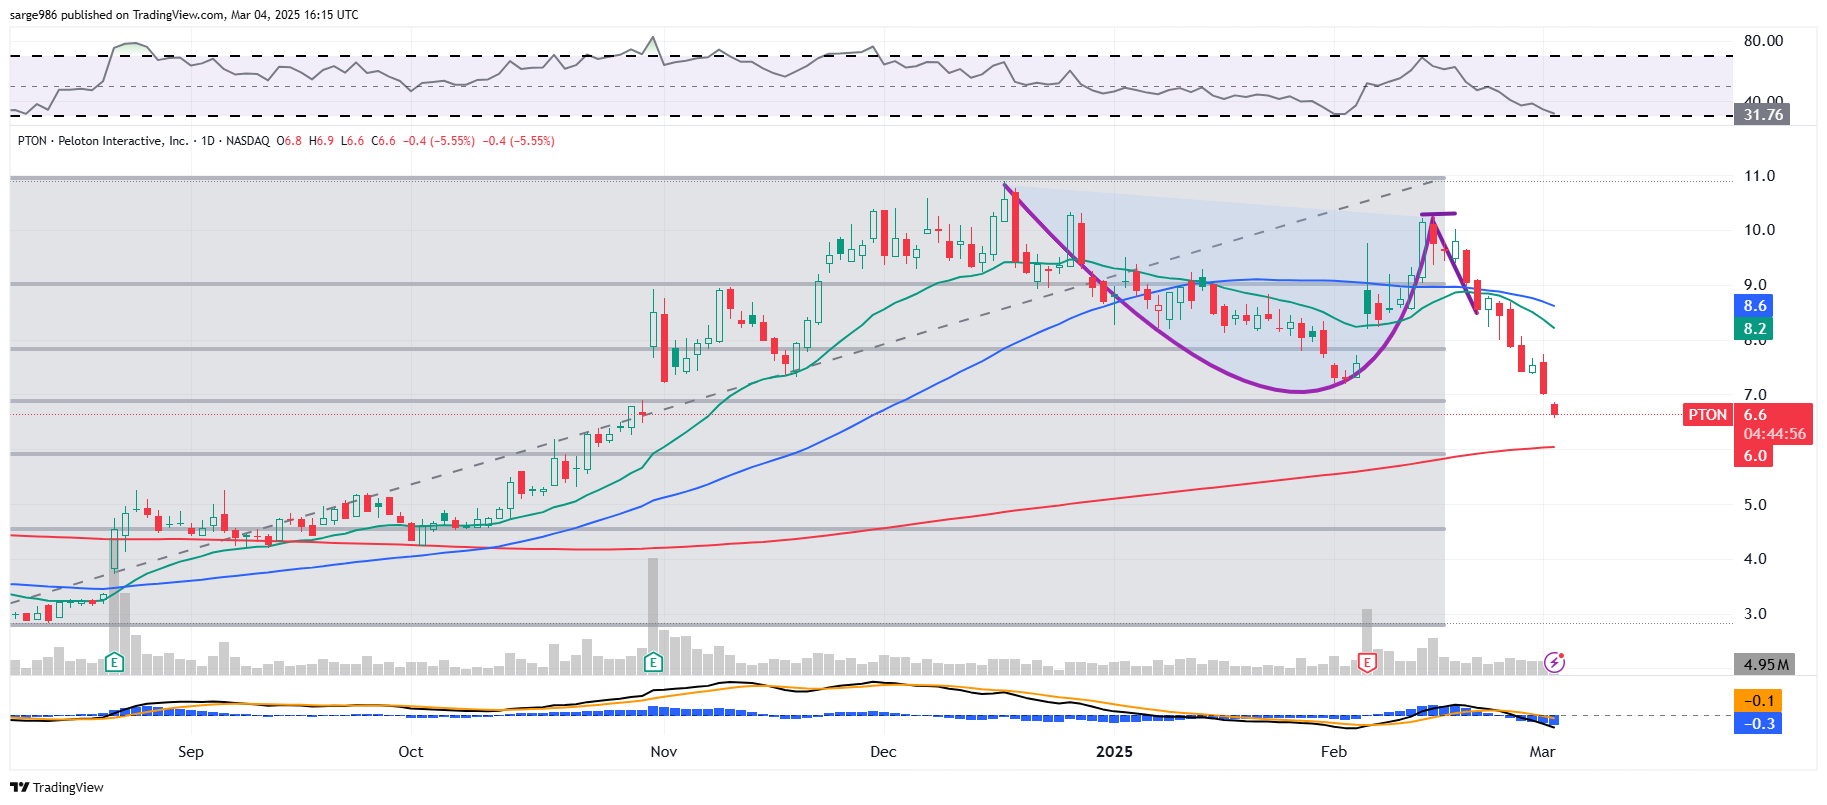
This is what I showed you three weeks ago:
This is what we see now:
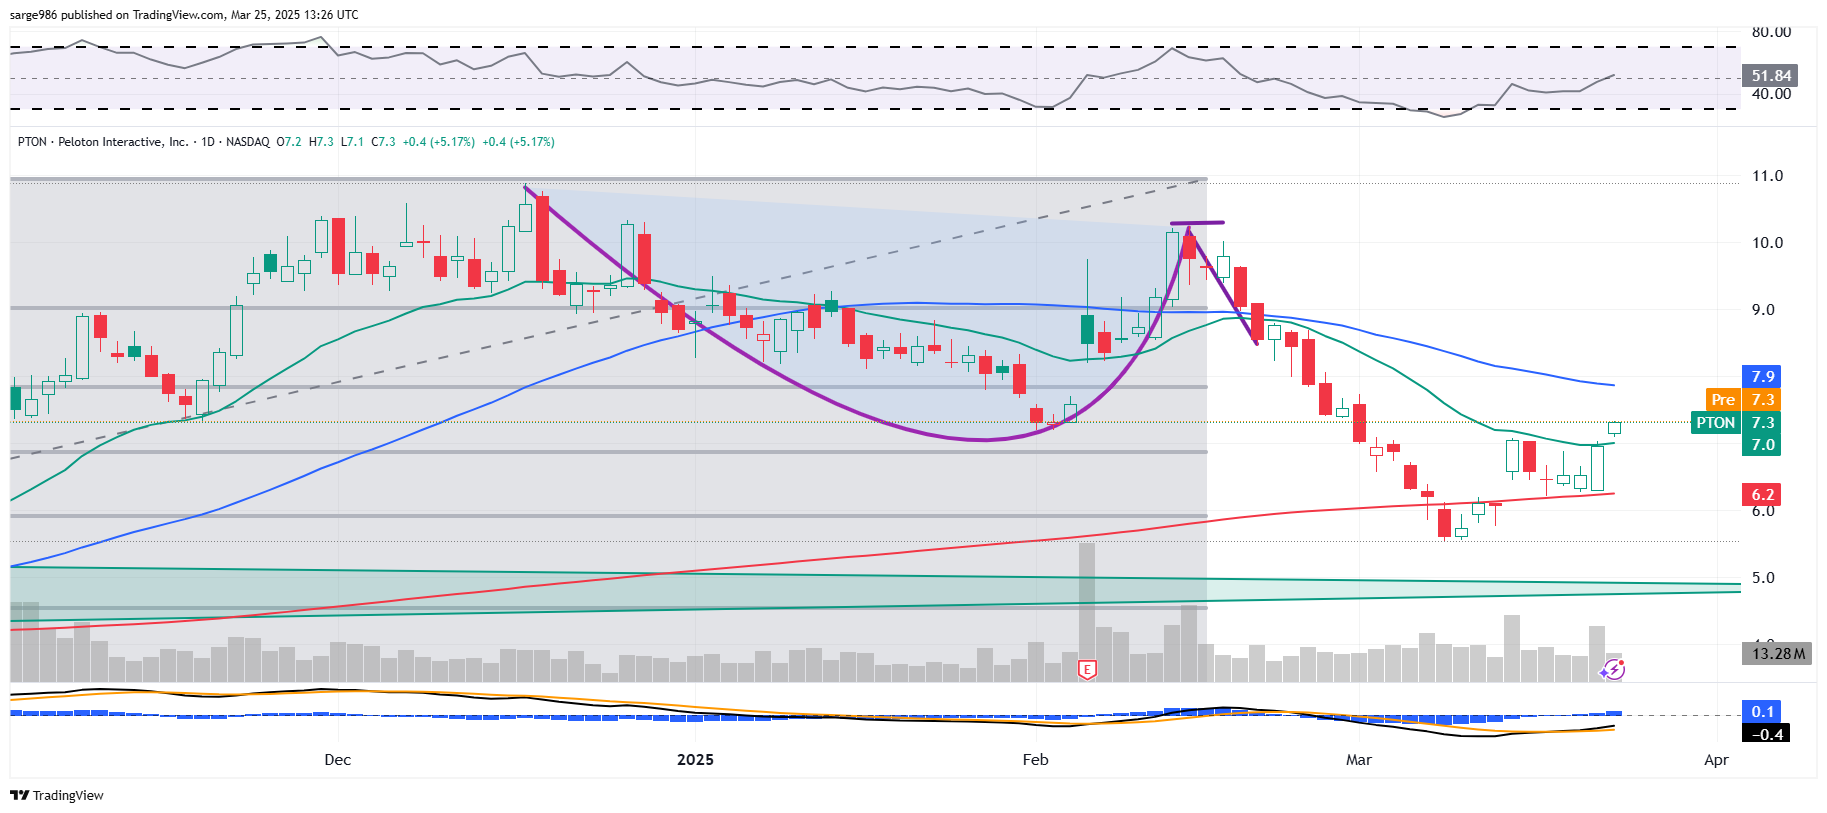
Readers will note that the stock has retaken that 21-day exponential moving average after quite a game of algorithmic air hockey between that line and the 50-day simple moving average. Now, PTON likely has increased participation on the long side by both portfolio managers and swing traders. That 50-day simple moving average, not too far to the stock's north, now becomes the pivot with both Relative Strength and the daily moving average convergence divergence indicator looking better than they were (the MACD still has a long way to go).
My Strategy
Target Price: $10
Pivot: 50-day SMA (currently $7.87)
Add: down to the 200-day SMA (currently $6.25)
Panic: loss of 200-day line for a second time.
At the time of publication, Guilfoyle was long PTON equity.
