If You're Looking for a V-Bottom, This May Not Be the Market for You
Sure, stocks rallied today, but with history as a guide, it's unlikely we'll see a V-bottom. Here's why.
You've reached your free article limit
You've read 0 of 1 free Pro articles.
The Market
If you just looked at the statistics from today’s trading, you would think it was a decent rally. But boy, look at the charts, and the last week looks like when you give a child a crayon for the first time and the hold it in their fist and scribble back and forth.
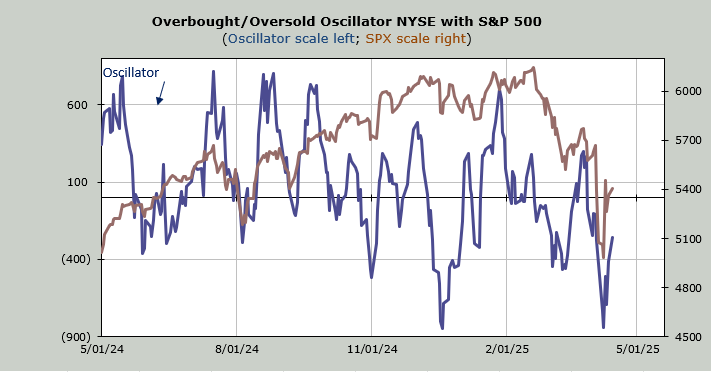
Even though most stocks have gone nowhere. Even though today was another sloppy day in the market, I still think a day or two of pullback would lead to another rally. I know I sound like a broken record but that’s just the way the indicators line up.
The indicators need time to cycle through to a decent overbought condition. I will repeat what I said before: I think my own Overbought/Oversold Oscillator will make it to the zero line, if not over it, before the rally is done. That’s why a few days of pulling back should give us another few days of rallying.
One final thought on this: the Russell 2000 has been green for two straight days which is not a big deal except that it hasn’t gone three straight green in nearly three months. That’s right; the last time it did so was in mid-January. Let’s see if we get a change in the pattern.
One of the questions I keep getting has to do with how much time should elapse between now and the next leg down. The answer is it’s unclear. That’s why I pay attention to the indicators!
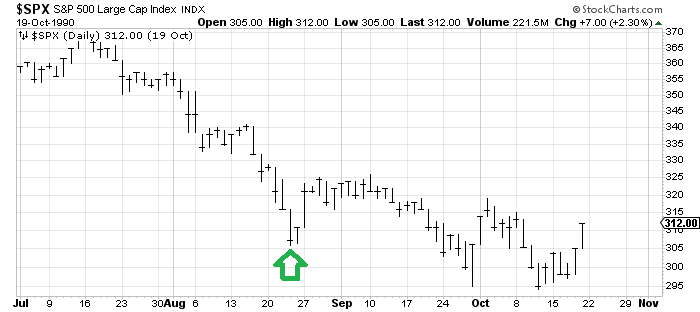
If we use prior examples, we can come up with answers all over the map. I tend to say weeks to months because that’s really the way it is. Here is a chart of the S&P in 1990. That panic low just after August 20th (green arrow) led to a rally that lasted a few days before going into sideways chop mode for three weeks. Then it headed down again.
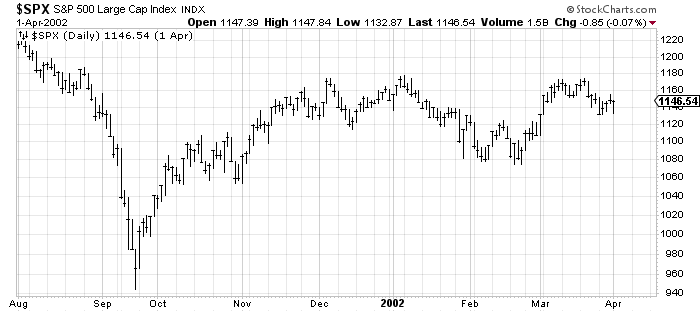
In 2001, we had the 9/11 panic when the S&P plunged to 950 and rebounded over the next week. Then it chopped about for a month, rallied, and went into a multi-month sideways move. It finally headed back down (not shown on the chart) in April 2002. And quite frankly it did not revisit that September low until July.
This is why I continue to say this is a trading market. This is not a set-it-and-forget-it market. This is unlikely to be a V bottom that just lifts up and keeps going.
New Ideas
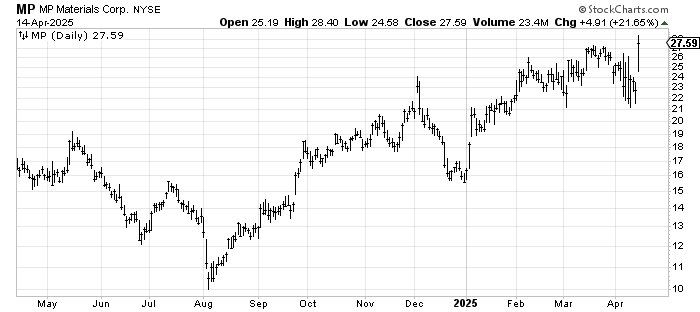
MP Materials MP is a stock I liked months ago. I have had a long-standing target of 28-29 for it. It tagged 28.40 today. If it gets back over 28, I’d take some profits. There is an outside chance at a target near 32 but let’s be conservative in this market.
A note on IGV: it didn’t do much today.
Today’s Indicator
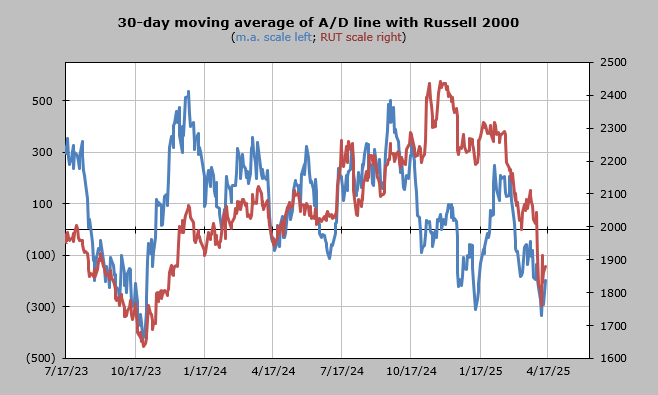
The 30-day moving average of the advance/decline line is more choppy than oversold, but it ought to lift a bit more over the next week.
Q&A/Reader’s Feedback
Helene welcomes your questions about Top Stocks and her charting strategy and techniques. Please send an email directly to Helene with your questions. However, please remember that TheStreet.com Top Stocks is not intended to provide personalized investment advice. Email Helene here.
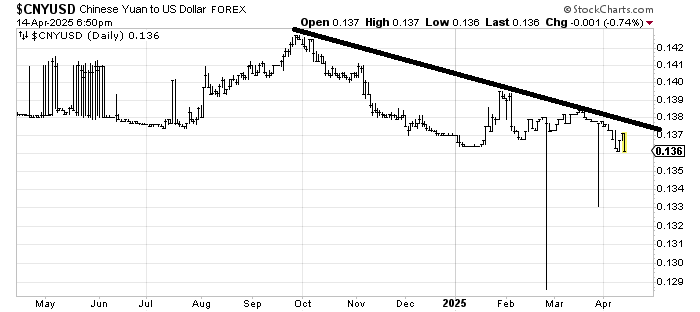
I am not sure anyone could read the chart of the Chinese Yuan to the USD using levels. You can see that the break of the summer low didn’t leave much of a breakdown. And the recent move to a lower low than January hasn’t exactly collapsed it either. So, just know that I would consider it in a downtrend unless/until it can get back up over that downtrend line and stay there.
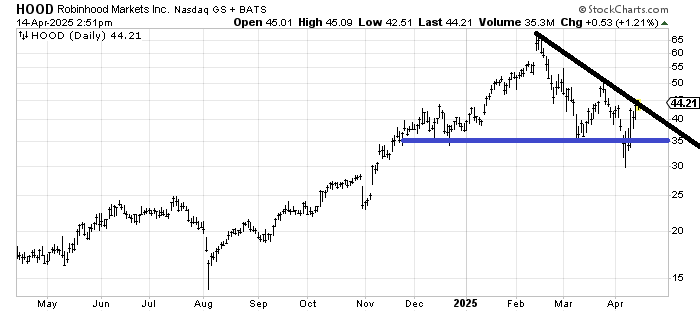
What’s impressive about Robinhood HOOD is that it could not break that flat blue line and hold on to it. If it can get itself up over this downtrend line, I think it runs into trouble around 50, but then pullbacks to the line would be buyable.
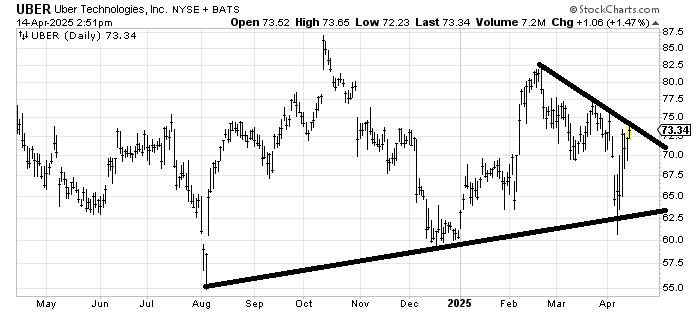
The question is, do I still think Uber UBER is building a base? Yes, I do. It is a growth stock that has gone sideways for a year. Like so many stocks, it needs to cross that downtrend line. It then runs into resistance around 77-78, but crossing that line is a first step.