If You're Enjoying the Choppiness, You're in Luck!
The big question is, when will we break out of this choppy zone?
You've reached your free article limit
You've read 0 of 1 free Pro articles.
The Market
Well, that was a fancy way to close the market with that last-minute spurt upward. Sure, I wanted to see what was up there, but it would have been nice to see it during the day, not on the close!
Not much changed in terms of the indicators. I apologize that I keep saying this, but it’s true. The short-term is back to an overbought condition, so yes, I expect the chop to continue.
I am, however, willing to allow that the cup and handle pattern I pointed out a week or so ago comes to fruition and the indicators to play catch up. It’s not my base case, but I can see how, after nearly four months of trading in the chop, folks just get tired and start chasing the upside.
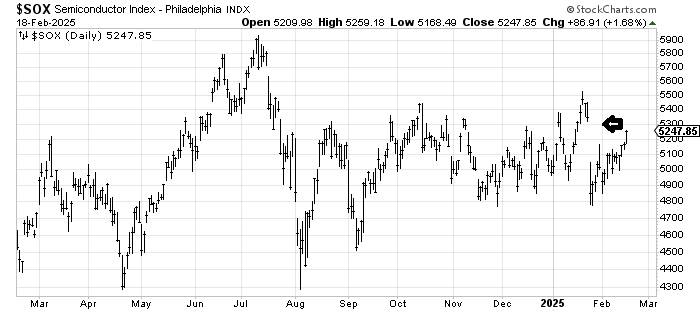
Here’s a few tidbits, though. Nasdaq has now closed green for four straight days. It hasn’t gone to five since the week of the election. The SOX, which never managed to break down, is now closing in on filling that gap above around 5340.
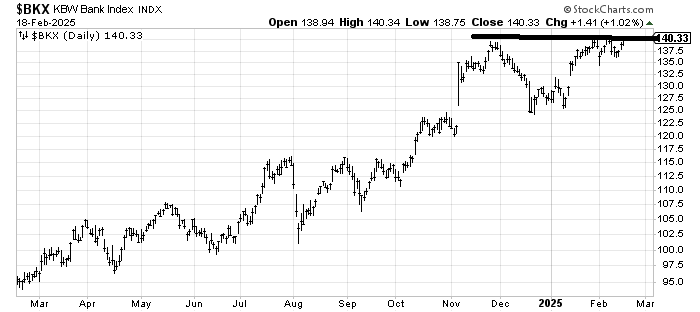
Yesterday, we looked at some charts to see if they could clear the upside. QQQJ inched higher today but did not clear anything in particular. However I did forget to note the banks. The Bank Index is at its highs so we need to see if it can clear that 140 area it has been bumping up against.
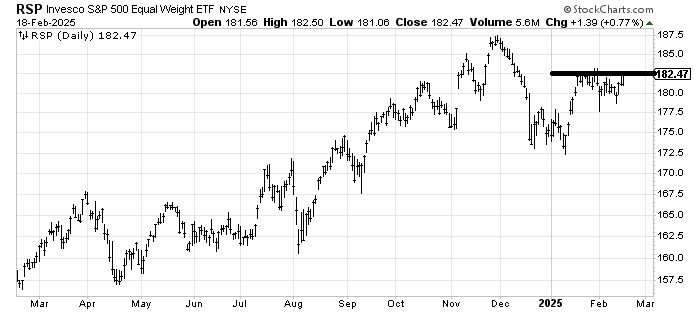
Then there is the RSP. Everyone will soon be back on the ‘broadening’ bandwagon if this breaks out. No, it won’t be a new high, but it will be a way to clear the chopfest of the last month.
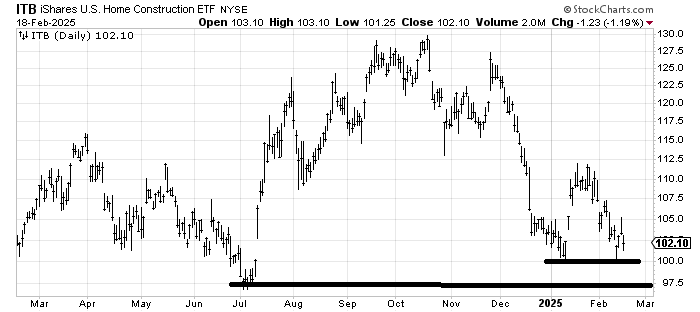
On the downside, I’m going to keep watching the iShares US Home Construction ETF ITB. Toll had pretty bad earnings after the bell. Let’s see if that support can hold. If 100 holds that would be mighty impressive. I would expect 97-ish to hold the first time down, but I’m focused on 100 right now.
New Ideas
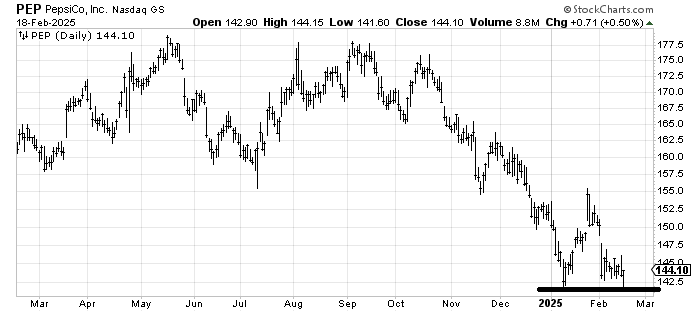
It continues to be tenuous, but Pepsi PEP did come down into that low 140s area and did not break yet again. However, now that it has hung around here for so many weeks, a solid break under there would be a negative. Otherwise, I’m still watching to see if it can hold here.
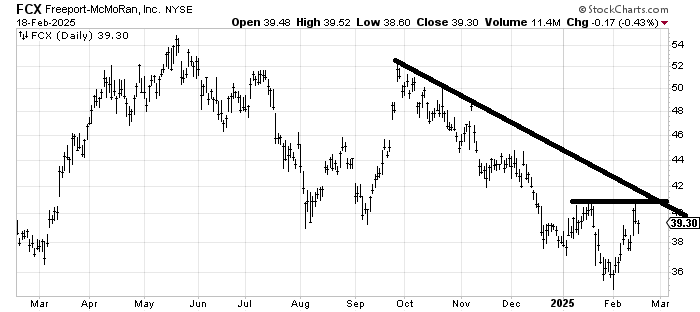
For the person who asked about Freeport McMoRan FCX recently, it is mapping out as I drew in. It would be great if it can wait a while longer so that when (if?) it rallies again it can get through the downtrend line at the same time it gets through the neckline of the potential head and shoulders bottom.
Today’s Indicator
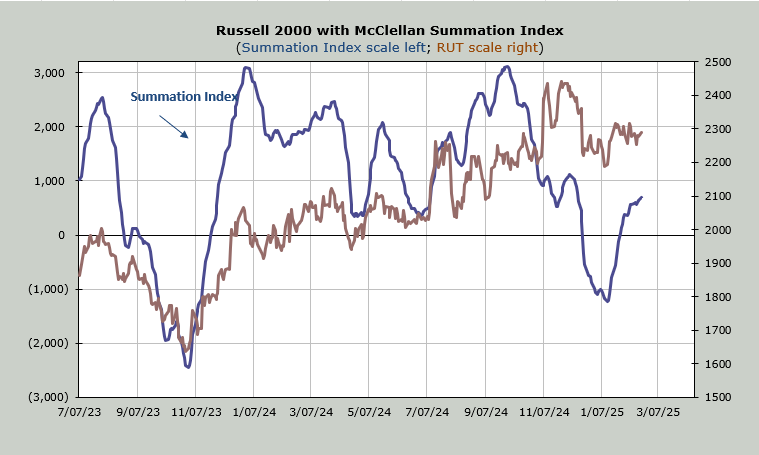
The McClellan Summation Index is still creeping up, with the operative word creeping! A net differential of -1000 advancers minus decliners on the NYSE halts the rise.
Q&A/Reader’s Feedback
Helene welcomes your questions about Top Stocks and her charting strategy and techniques. Please send an email directly to Helene with your questions. However, please remember that TheStreet.com Top Stocks is not intended to provide personalized investment advice. Email Helene here.
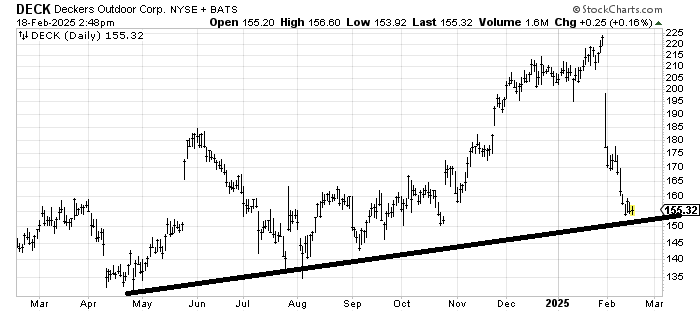
Before we take a look at the chart of Deckers DECK I want you to know that for years I hand-posted this chart. Had some great trades, too. Then the price got so high, and no one seemed to care about it anymore, so I put it in the discard pile. Not long after, the stock split and made it a more normal price. Needless to say, I haven’t looked at the chart in a long time, so I was shocked to see how far it had fallen.
It's got support in this 150 area. It’s probably oversold enough to bounce, but wouldn’t you want to wait until it sets up a pattern before jumping in? Clearly, another tumble under 150 would look awful, but there is support from that entire 4-5 month sideways move from last summer down there. My guess is if it is going to be good again, the pattern of sideways will set up again.
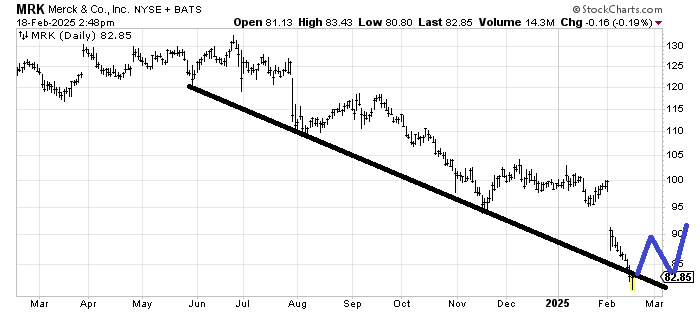
Merck MRK is oversold but that is the best I can say about it. Sure, its got this line that it has bounced off of but look at the bounces: they are merely bounces and nothing more. At least let it try and map out a little bit like I have drawn in before getting involved for more than a bounce.
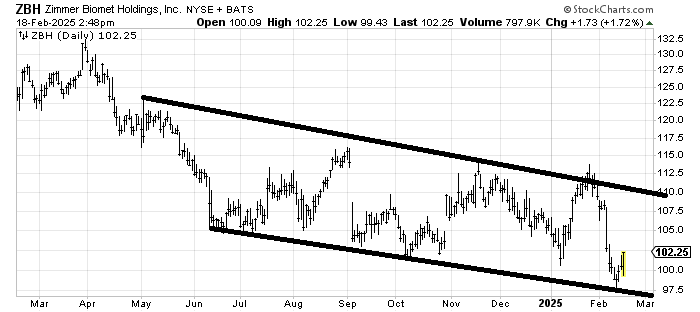
Zimmer Biomet ZBH has been in this down channel for nearly a year. Unless/until that pattern changes, that’s what we play, buying at the lower line and selling at the higher one.
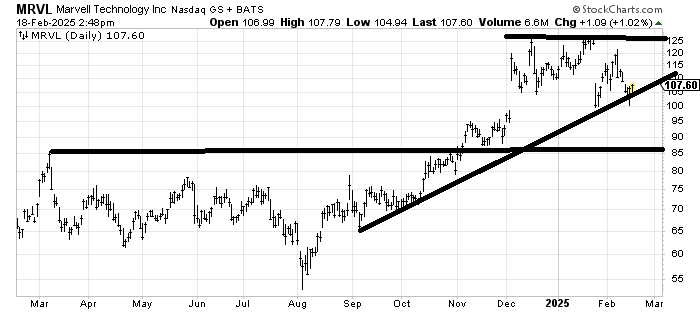
Marvel MRVL met its upside objective from that base it broke out of when it got to 115-120. It has also held the uptrend line It’s not my cup of tea to love a chart like this, but at least you know you are wrong if it breaks 100.
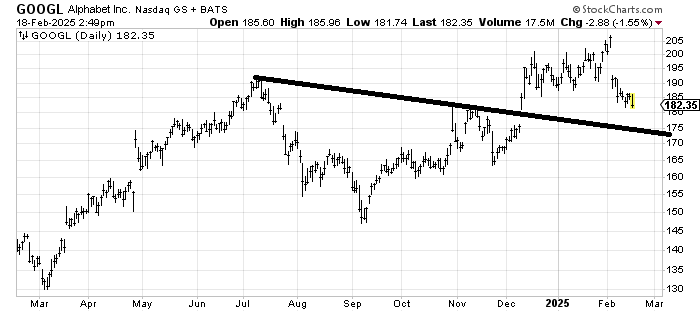
If Alphabet GOOGL can come down and fill that gap near 175 around the same time it tags that line, I’d probably be a buyer, thinking the risk/reward is pretty good down there.
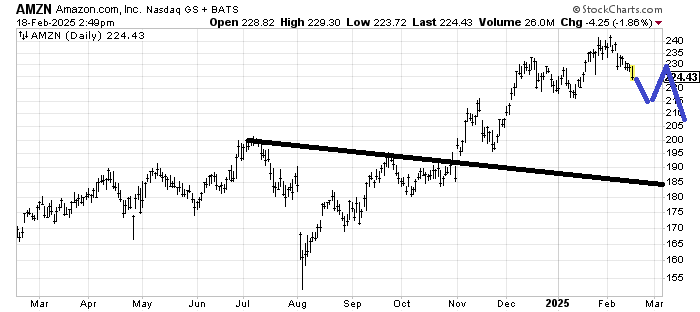
Last fall, I recommended Amazon AMZN, figuring the breakout over that line would get folks excited. It measured into the 240 area, which is where it got just before earnings. It hasn’t truly crapped out after earnings, but you do not want to see it map out as I have drawn in blue. For now, I would say, let’s see if it can hold 215-ish because for the first time since August, it is trading under its 50 dma.
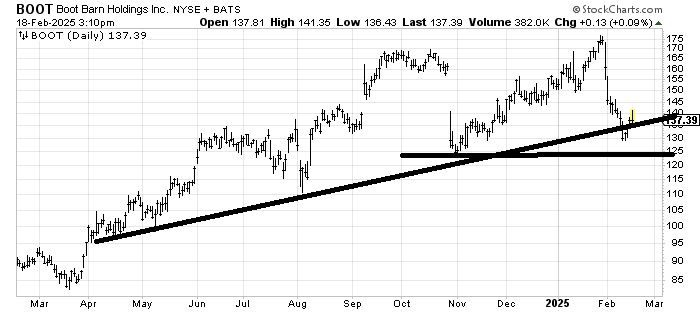
Now that Boot Barn BOOT has had a crummy rebound, it had better not break 125 on the next trip down. And I do think it comes back to retest 125-130. It just had better hold.