If We Rally This Week, the Question Is, Will It Just Be the Index Movers That Move?
After a choppy week that saw the Dow finish higher, what's next for stocks?
You've reached your free article limit
You've read 0 of 1 free Pro articles.
The Market
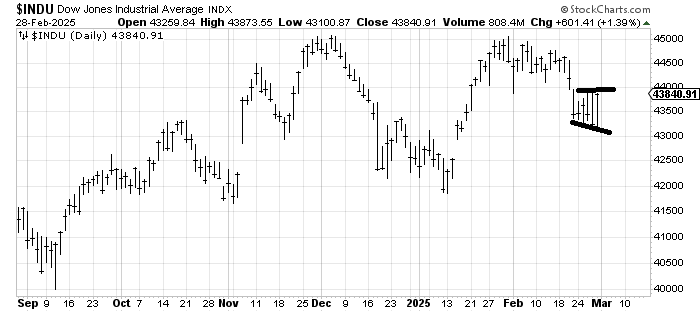
When you sit back and look at what happened last week, and I mean, not emotionally, but really take a look at the charts and the math, you will discover that the DJIA was actually up on the week. But more than that, step back and look at the chart of the DJIA and notice something.
While the range got wider each day, it mostly looks like chop, doesn’t it? The big decline was in the prior week. I believe the textbooks call that a flag. But I’ll be honest: I am not great at patterns unless they are head and shoulders!
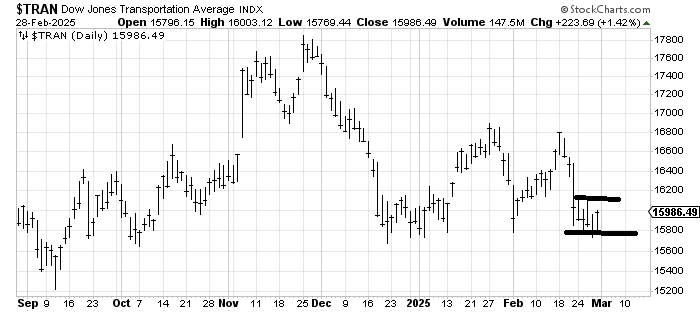
It wasn’t just the Dow; the Transports, too, spent the week chopping about.
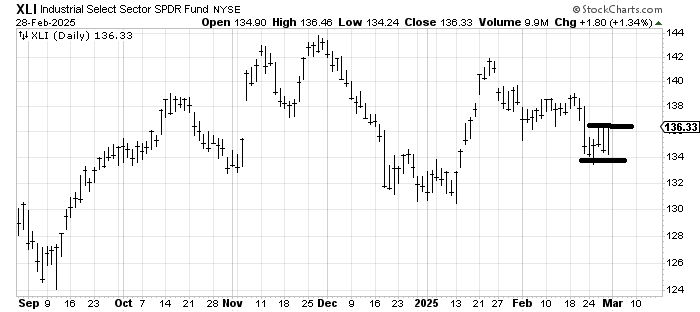
Also, the industrials. And look how far off the January low the XLI is.
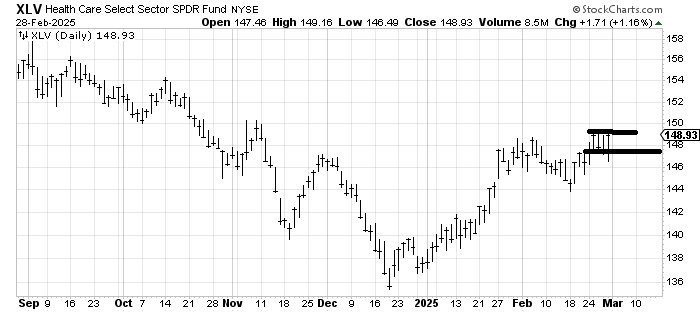
Even the drugs, which I have liked, spent the week-while not at the lows and closer to the recent highs-going sideways. They only outperformed, they didn’t make any progress.
I am not saying there wasn’t selling, but I am noting that the majority of the selling was in stuff that was over-owned, over-loved, and growthy—the index movers.
Was Friday’s late-day surge an end-of-the-month move? Maybe. But I prefer not to rationalize a move. Rather I would just say that I still believe we are short-term oversold (or just about there) and that if we see give-back early in the week this week, we’d still be due to rally. The only question I have is if we rally everything or do we go back to the situation where when the mega-cap stocks rally, they do so at the expense of everything else so that all those stocks that held up last week get left for dead.
Let me finish by noting I do not think we are beyond a period of volatility. It remains a trading market.
New Ideas
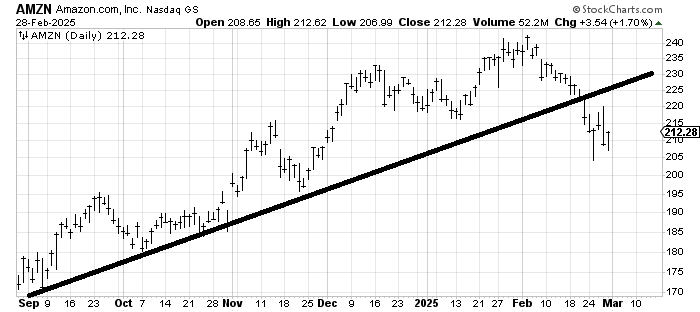
Last Tuesday I said I liked the reversal in Amazon AMZN for a trade. It rallied, came back down and did not make a lower low. I still think it is worth another trade.
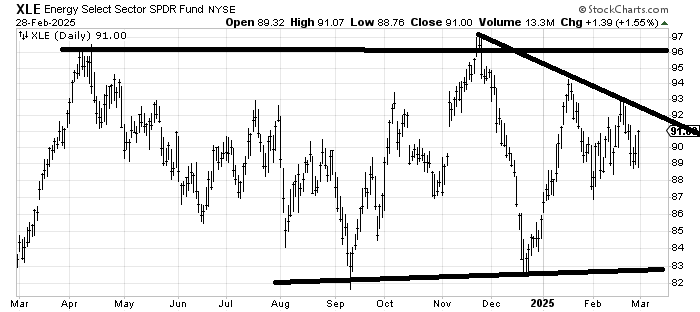
Two weeks ago, I said I was watching EOG Resources EOG for a potential breakout. It then took a dive straight down. But I cannot get my eyes off the energy names. If XLE can cross that downtrend line, that is a change, having been in this downtrend since November.
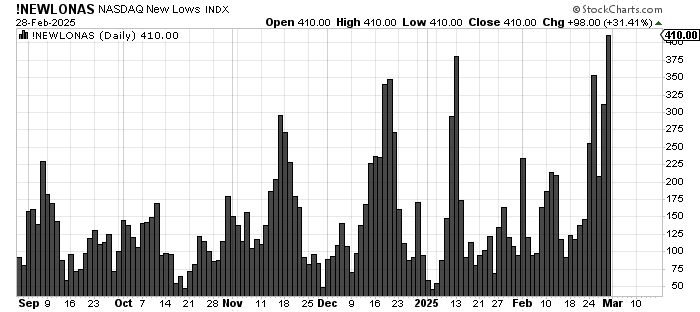
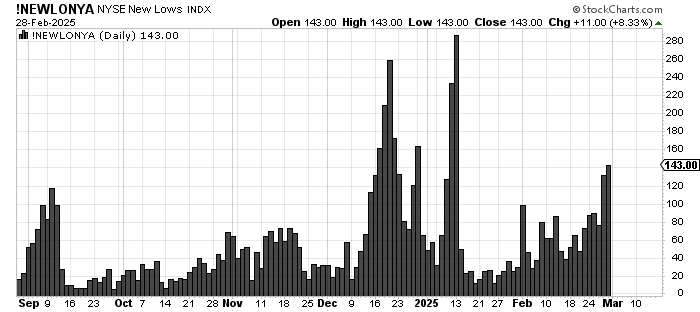
Today’s Indicator
The new lows on Nasdaq expanded on Friday (bearish). The new lows for the NYSE are still far away from the January lows (see the discussion above about the chop; it is bullish). So, we’ll call it dealer’s choice.
Q&A/Reader’s Feedback
Helene welcomes your questions about Top Stocks and her charting strategy and techniques. Please send an email directly to Helene with your questions. However, please remember that TheStreet.com Top Stocks is not intended to provide personalized investment advice. Email Helene here.
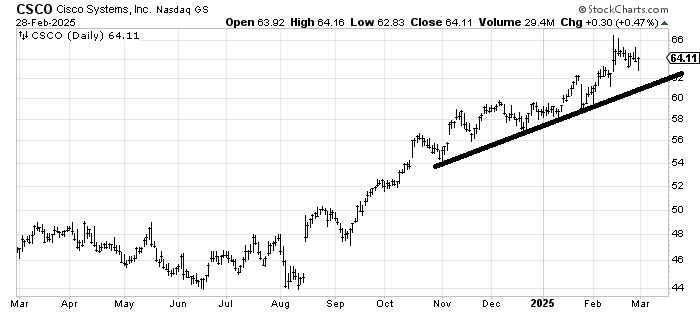
I am so annoyed with myself because last summer, I started jotting down Cisco CSCO as a positive chart and never bothered to follow through with a trade on it, and now it has had quite a run-up. I have a measured target in the 68-72 area. If it breaks that uptrend line, then it’s time to exit. It’s just not my style to chase it here, though.
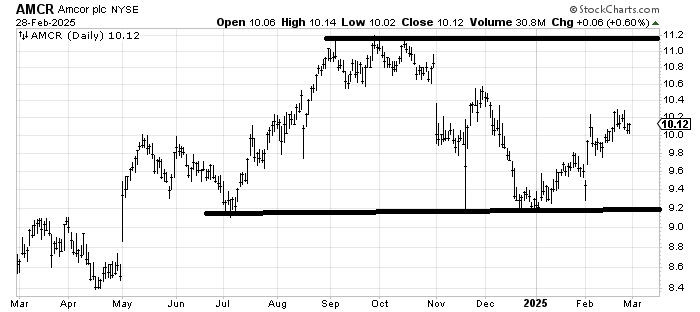
If I want to be generous, I would say Amcor AMCR is in a trading range. Right now, it’s smack in the middle, so it feels like a coin toss as to which way it will go. I don’t know what that shakeout was in late January/early February, but it caught both sides long/short. I’d say it probably continues creeping upward.
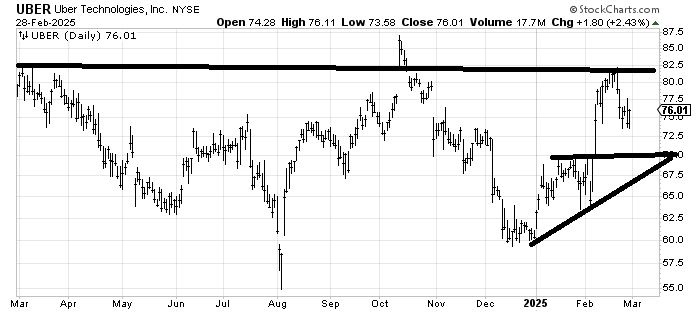
I have liked Uber UBER for quite some time, but in February, when it finally filled that gap near 80, I thought we should take something off the table. Notice a few things, though: it is a growth stock, and it spent the week chopping, not plunging, and it may have kept rallying after that gap fill at 80, but it still got stuck at resistance. If it fell back toward support at 70, I’d probably have another look at it again.
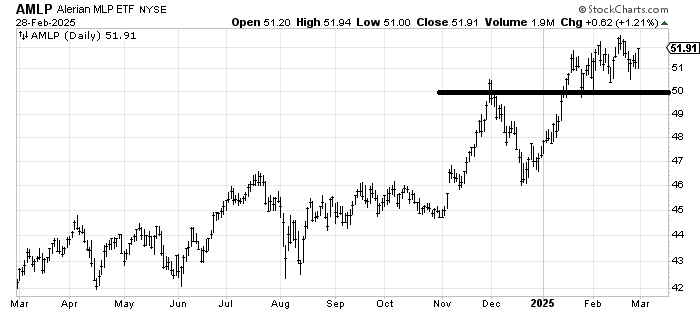
AMLP AMLP has a measured target in the 54-ish area. We obviously would not like to see it slide under 50.
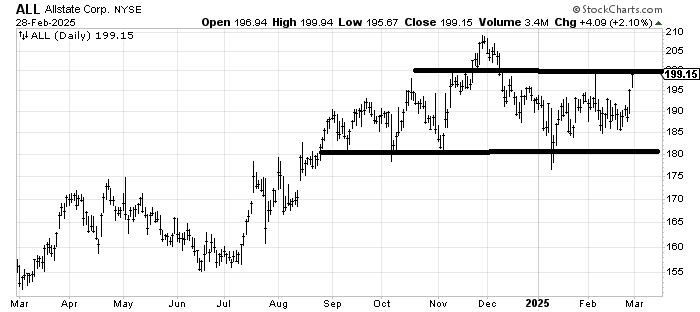
It’s difficult for me to chase Allstate ALL up here after the surge it had last week, and it has resistance at 200 in the near term. Even if it gets through 200, it has resistance all the way up to 210. I can measure a target at 210 and possibly one near 220—if it can get through 200.
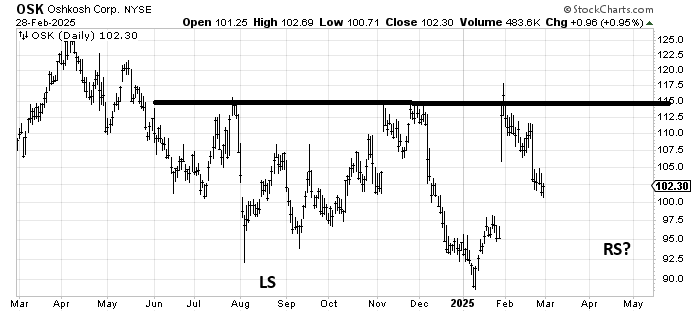
Forgetting the near term on Oshkosh OSK, let’s talk about what would have to happen to the chart to get it set up for a nice base over the intermediate/longer term. Does it need to fill that gap from late January? It doesn’t, but notice how that left shoulder was an up/down pattern that worked out over a few months. That, if it were to play out, would give some symmetry to the right side of the pattern (the right shoulder). So that’s what I would watch to see if it can develop in the coming months.
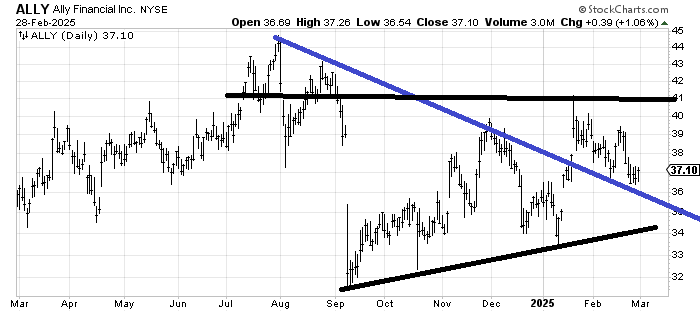
Ally Financial ALLY looks like another trading range stock to me. Sure, it crossed that blue downtrend line (bullish), but was unable to maintain the gap up and gave it all up and more. Near 35, it fills a gap and would probably be oversold if it got down there, otherwise it looks like a chopfest to me.